
Childhood obesity is a national crisis and a leading cause of ill health and premature death – in England, one in three children are overweight or obese by the time they leave primary school. Obese or overweight children are more likely to become obese or overweight adults, which increases their risk of developing cardiovascular disease, type 2 diabetes and some cancers.
We live in an obesogenic environment that encourages weight gain and obesity, and excess sugar intake has become the norm. Children and adults are consuming more than double the recommended amount of sugar and this is an underpinning factor of the obesity epidemic.
PHE’s Sugar Reduction Programme: A world first
The government is committed to tackling childhood obesity, and Childhood obesity: A plan for action, published in August 2016, included a commitment for PHE to lead a transparently monitored sugar reduction programme.
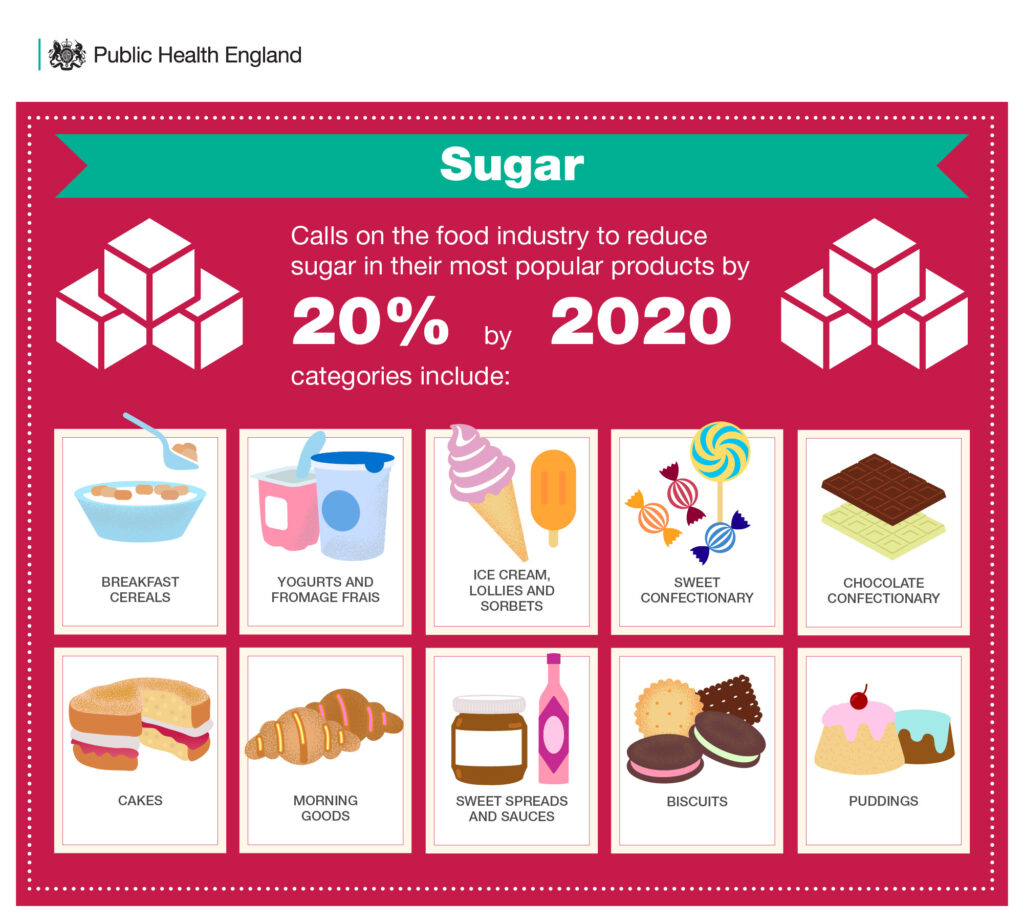
Launched in 2016, the programme challenges the food industry – from retailers to manufacturers, restaurants, cafés, takeaways, pubs, entertainment chains and delivery services – to reduce the sugar in the products that contribute most to children’s intakes by 20% by 2020.
This is the first time a sugar reduction programme of this kind has been conducted anywhere in the world, so both implementing it and assessing its progress come with challenges.
The data challenges we have encountered
The sugar reduction progress report published this week is the first assessment of progress to date, measuring how far the food industry has gone towards meeting the initial challenge of a 5% reduction in the first year.
We have used two data providers to measure progress in this report: Kantar Worldpanel data provides volume sales and nutrition information for retailers and manufacturers, while MCA data is used to provide volumes for food purchased out of the home – with nutrition data coming from menus, online and businesses themselves.
Sales weighted averages (SWA) were used to set both sugar and calorie guidelines to monitor industry’s progress against a 2015 baseline. A SWA is calculated by weighting the sugar level of individual products and calorie levels of single serve products by their volume sales. This means companies need to focus reduction efforts on their top sellers to make the biggest impact.
This report is also probably a world first, with an analysis of this type having never before been published. As such, we have encountered some limitations with the data which has prevented us from being able to undertake a full analysis as originally intended.
-
Incomparable data for the out of home sector
In this year 1 report, only the current levels of sugar and calories in products likely to be consumed on a single occasion have been presented for the out of home sector (e.g. pubs, restaurants, cafes, takeaway and delivery services).
It has not been possible to make comparisons with the baseline or to measure the progress the out of home sector has made in year one of the programme. This is because after the baseline was set for the out of home sector in the March 2017 report, PHE took the decision to change the data supplier to one that could deliver a more comprehensive dataset for more robust future monitoring.
The two datasets are not directly comparable as there is too little like for like product information. There are also some gaps in the data as the out of home sector is not legally obliged to provide nutritional information as retailers and manufacturers are, although some businesses do voluntarily provide some of this on their leaflets, menus or websites.
However, the data we have suggests products likely to be consumed on a single occasion sizes are substantially larger in the out of home sector – double those of retailer and manufacturers.
We aim to provide a more comprehensive assessment of progress for the out of home sector in the 2019 update report.
-
Limited data on cakes and morning goods
Progress for 8 out of the 10 food categories for retailers own brand and manufacturers branded products has been measured against a 2015 baseline. There has been progress on reducing sugar in 5 of the 8 categories, with an overall 2% reduction. Whilst this does not reach the 5% reduction ambition for year 1, it is an encouraging start from the food industry.
For cakes and morning goods, a large proportion of products had only estimated nutrition information (Kantar World Panel had calculated average values from similar products) and in addition, sugar per 100g could not be calculated as too few products had their accompanying weights available in both years, so these have been excluded. For these products, nutrition information is often not provided per 100g so the weight of the product is needed to calculate sugar per 100g.
We are working with the data supplier to ensure a set of data that is comparable with the 2015 baseline and year 1 data is available, so that next year’s report can analyse sugar reduction progress made in all categories.
-
Ice cream, lollies and sorbets
The data presented in the report for ice cream, lollies and sorbets are provisional. This is because there is inconsistency in reporting the nutrition content of these products – some use levels of sugar per 100g and others 100ml. In the analyses presented in this report, we’ve converted mls and grams based on average conversion factors across ice cream types, which is not a precise conversion for each individual product. In the report we have focused on using levels of sugar per 100g as more companies use this.
PHE will work with manufacturers, retailers and the data provider to improve product level information for next year’s progress report. This may result in revised baseline and year 1 figures being published.
-
Using “shopping basket” data
The data used for the analysis is based on what people actually buy. This is known as “shopping basket” data. Although it can tell us how much sugar is being purchased, it cannot tell us precisely what people are consuming.
This data is at the end of the supply chain, so companies may have already improved products still going through the reformulation cycle or have made commitments to change recipes this year. Therefore, the datasets used may not reflect all the sugar reduction and product reformulation activity that has taken place or is in the pipeline.
A call to action
The lack of data for retailers and manufacturers in the cakes and morning goods categories, and all categories for the out of home sector, does not mean they have been let off the hook on reducing sugar in their products. We are expecting both sectors to take action and we will be reporting on their progress in next year’s report.
This is particularly relevant for the eating out of home sector, where portion sizes are on average more than double those of retailers and manufacturers. Around a quarter of calories are eaten out of home and more than a fifth of children eat out at least once a week. We expect this sector to step up and take comprehensive action.
We continue to encourage businesses to focus reduction efforts on their bestselling products with high levels of sugar. Transparency is key to this programme, and we will report on progress again in 2019 and 2020.
Read our sugar reduction overview blog for more details on the programme.