
This is the latest in a series of blogs summarising what we learn each time we update the Public Health Outcomes Framework (PHOF). The latest update includes 51 indicators, some of which we explain below.
The PHOF sets out a vision for public health. This includes the desired outcomes and the indicators that will help us understand how well public health is being improved and protected.
It aims to reflect a focus not only on how long people live, but on how well they live at all stages of life.
Life expectancy and inequality in life expectancy
Several indicators in the overarching domain have been updated to the latest period of 2015-17.
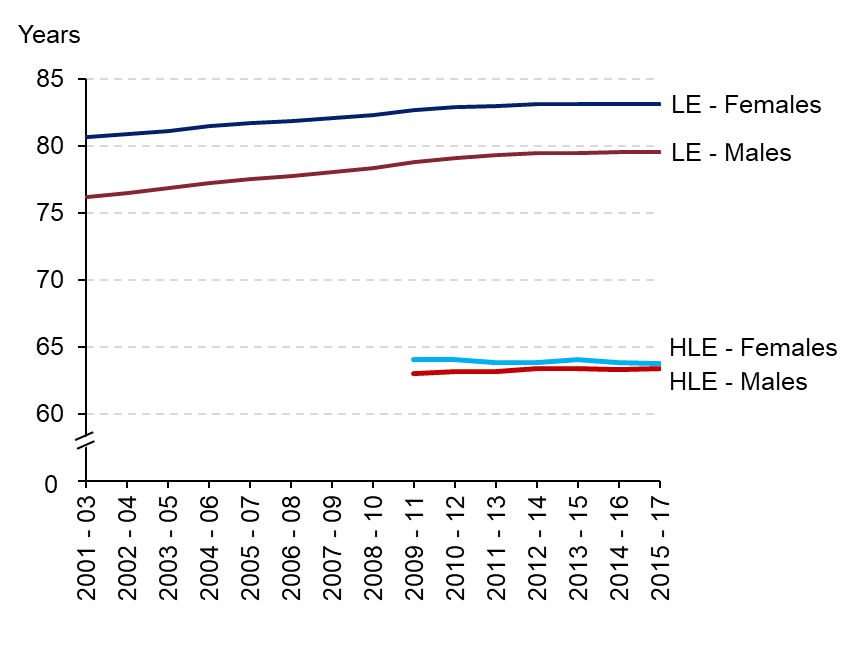
Healthy life expectancy (HLE) at birth and life expectancy (LE) at birth and at 65 were released by the Office for National Statistics in December 2018. The update showed that, for England, male HLE has increased by four months since 2009-11, while female HLE decreased by three months over the same period.
Both male and female LE have increased since 2009-11, by nine and five months respectively (figure 1).
Trends in LE and possible reasons for the recent slowdown in improvement have been explored in further detail in a recent publication by PHE.
Figure 1: Trends in life expectancy and healthy life expectancy in males and females, 2001-03 to 2015-17
New to the public domain in this release are updates to inequality in life expectancy for England, regions and local authorities.
Inequality in life expectancy in the PHOF is estimated using a summary measure called the slope index of inequality (SII). The higher the value of the SII, the greater the inequality within an area. For more guidance on interpretation please see here.
The latest data in the PHOF for 2015-17 indicates a widening in inequality in life expectancy at birth within England since 2010-12. For males, the SII for England was 9.4 years - wider by 4 months; for females it was 7.4 years, wider by 7 months than 2010-12.
We have adjusted the way we present this information, these indicators have been condensed into a single indicator labelled as 0.2iii - Inequality in life expectancy at birth, split by males and females.
However, be careful not to compare different levels of geography. The SII for England takes account of the full range of deprivation and mortality across the whole country.
This does not therefore provide a suitable benchmark with which to compare local authority results, which take into account the range of deprivation and mortality within much smaller geographies.
Hospital admissions for unintentional and deliberate injuries in children and young people
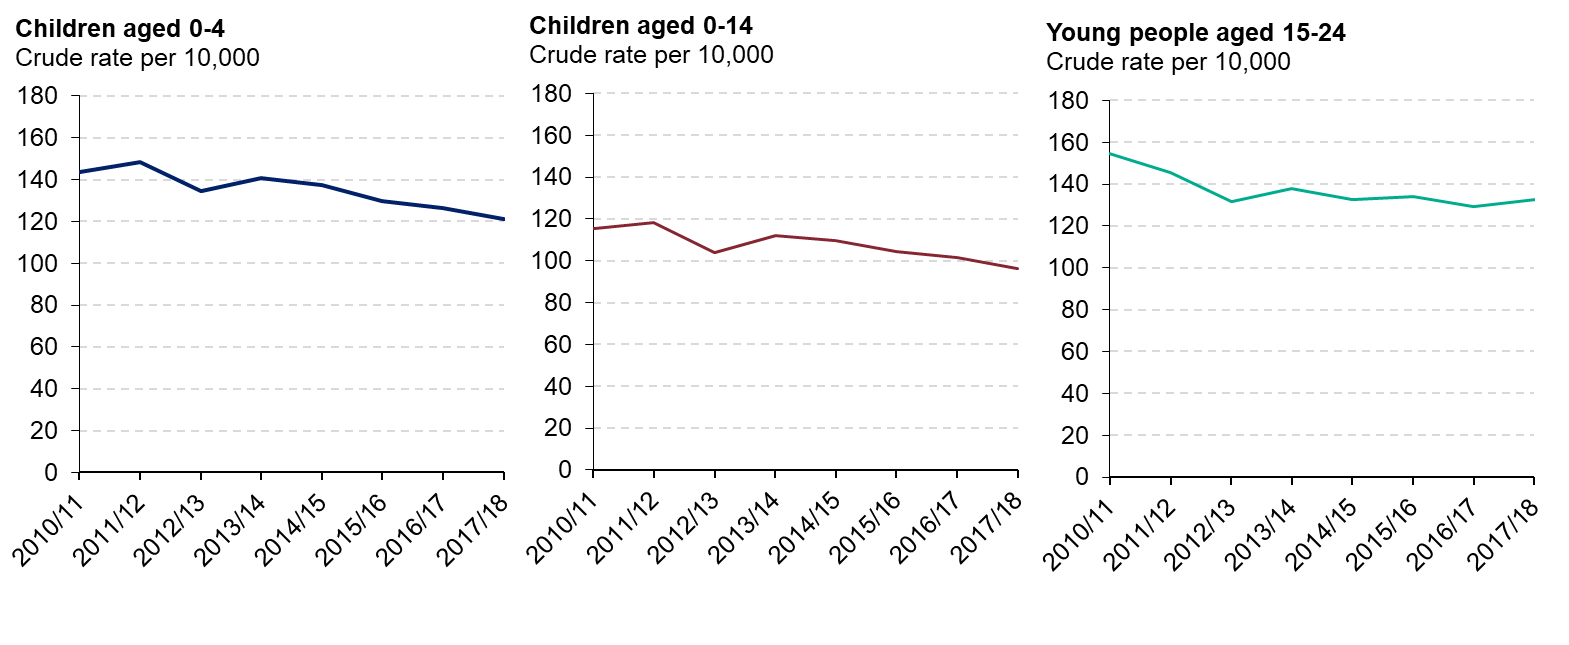
The crude rates of admissions for unintentional or deliberate injuries for children aged 0-4 and 0-14 were 121.2 and 96.4 per 10,000 population respectively in 2017/18. These were both significant reductions from 2016/17 and continued a longer term decreasing trend seen over the last 5 years.
However, the opposite was seen for the crude rate of admissions for young people aged 15-24 which significantly increased from 2016/17 to 132.7 per 10,000 population in 2017/18.
However, this increase is not reflected in the longer-term trend which shows a decrease based on the five most recent time points.
Figure 3: Admissions for unintentional and deliberate injuries in children and young people, 2010/11 to 2017/18
Emergency admissions for falls and hip fractures
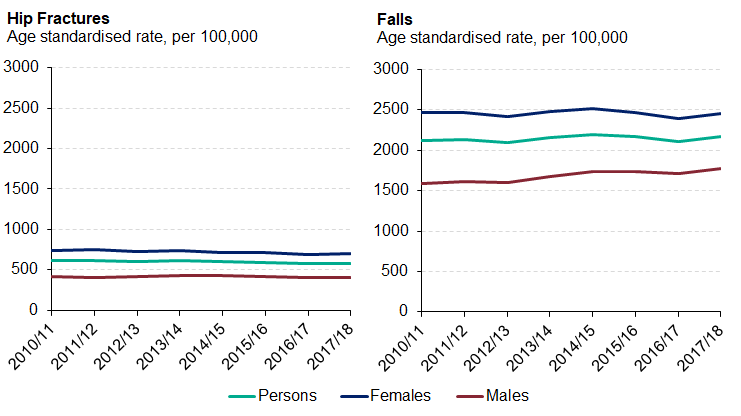
The rates of emergency admissions due to hip fractures and due to falls both increased for those aged 65 and over in 2017/18 compared with 2016/17. For falls this represented a statistically significant increase, whilst for hip-fractures the change was not significant.
Females have consistently had higher rates of emergency admissions than males for hip fractures and for falls across all three age groups, see figure 4.
Figure 4: Emergency admissions for hip fractures in males, females and persons aged 65+ from 2010/11 to 2017/18
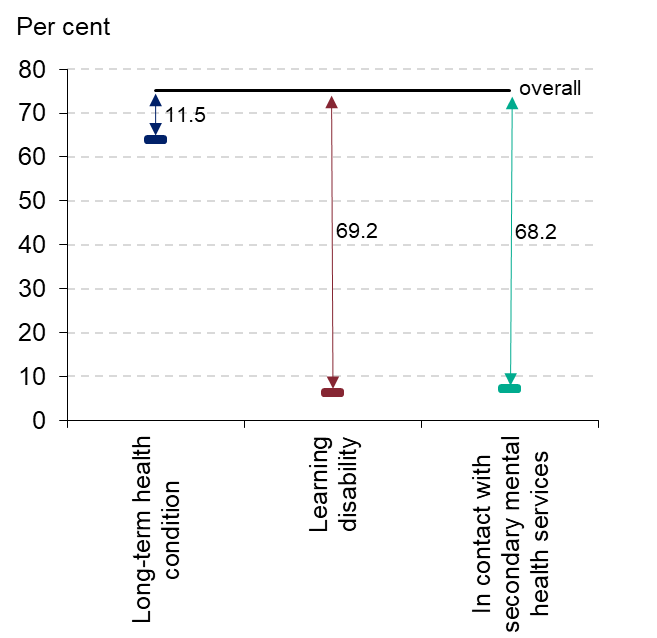
Gap in employment rates between those in contact with secondary mental health services and the overall population
The overall employment rate (those aged 16-64) in England in 2017/18 was 75.2%
The gap between the employment rate for those with long-term health conditions and the overall employment rate decreased in 2017/18 to11.5 percentage points.
For those in contact with secondary mental health services, the gap was 68.2, meaning it has widened since 2016/17.
The gap in employment rate between those with a learning disability and the overall rate for 2017/18 increased slightly (but not significantly) compared to 2016/17 to 69.2 percentage points.
Figure 6: Gap in overall employment rate in England and rate in people with health conditions, 2017/18
To see what else has been updated this time or if you’d like to view the data for your local area, visit our webtool at www.phoutcomes.info. If you’d like to send us any feedback please do so via phof.enquiries@phe.gov.uk.
Consultation
PHE have published a proposal for changes to the Public Health Outcomes Framework indicators for 2019-2022. PHE would like feedback from users on this proposal to ensure the changes are helpful and appropriate.
You can have your say by completing the online survey. The survey will close on 17 February 2019