This week marks the 4th update to “Routes to Diagnosis”, a key part of England’s efforts to improve cancer survival.
Back in 2009 this project was developed as we knew that cancer survival in England was lower than the European average.
Part of the reason for this was attributed to later stage diagnosis of cancer in patients in England – later diagnosis means less chance of being cured and therefore less chance of surviving.
And studies have also shown that the survival of cancer patients in England is poorer particularly in the first year after diagnosis and for patients aged over 65.
Understanding cancer diagnosis
To help us better understand cancer diagnosis, we bring together multiple data sources through our Routes to Diagnosis work, which identifies eight different routes through which patients get diagnosed.
It’s the biggest collection of data of this kind and by continuing to develop it we are building a unique insight to why some cancers in England are diagnosed late, and how we can work to improve on this.
Crucially our data allows us to see where patients are being picked up through emergency presentations (EPs) compared to managed routes like urgent GP referrals or cancer screening.
We need to know this because when a patient presents through an EP, often by attending an A&E department, survival rates are much lower.
Encouraging news in our 4th update
We now have data on almost 2.5million cancer diagnoses from 2006-2014, showing us differences and inequalities in age, sex, deprivation, ethnicity, geography, cancer stage and survival.
The data is broken down into 55 individual cancer groupings, providing valuable information on rarer and less common cancers which are frequently excluded from cancer statistics because of the small numbers involved.
A geographic breakdown by the new Cancer Alliances and survival trends is now included. This is the first time this information has been published and in general it shows that cancer survival in England is improving for many cancer types and indeed for many routes.
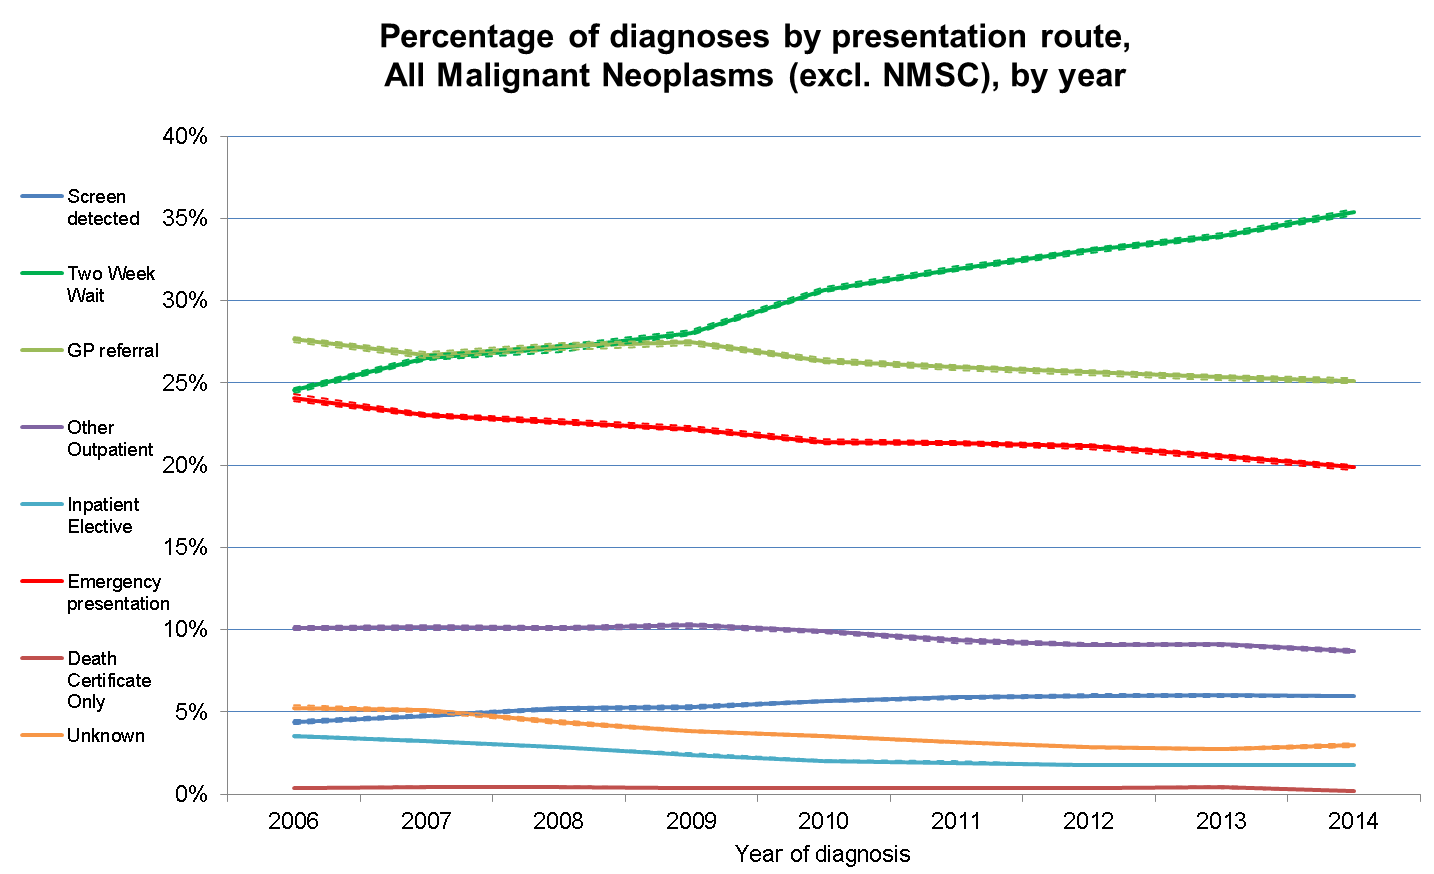
Overall, the trend of EPs is changing and is going down, which is of course good news not only because of the implications of better survival rates for patients, but because of the strain that urgent and emergency care places on the NHS.
We also know that the proportion of two week wait referrals - the time between an urgent referral and an appointment for suspected cancer - are going up. This means more people are entering the system through managed routes, which is good news.

The update shows that for cancers diagnosed in 2014, 20% were diagnosed as an EP, compared to 24% in 2006, despite the increase in cancer incidence over this time.
For some cancers where a very high proportion of patients are diagnosed as an EP, like pancreatic cancer, we have seen a change from 50% in 2006 to 45% in 2014.
For the first time we can also see an improvement in survival rates over this time as well. For example, in lung cancer, the 12-month net survival rate for EPs has improved from 12.5% to 15.1%.
The data includes screening and the percentage of cancers being picked up through different national programmes.
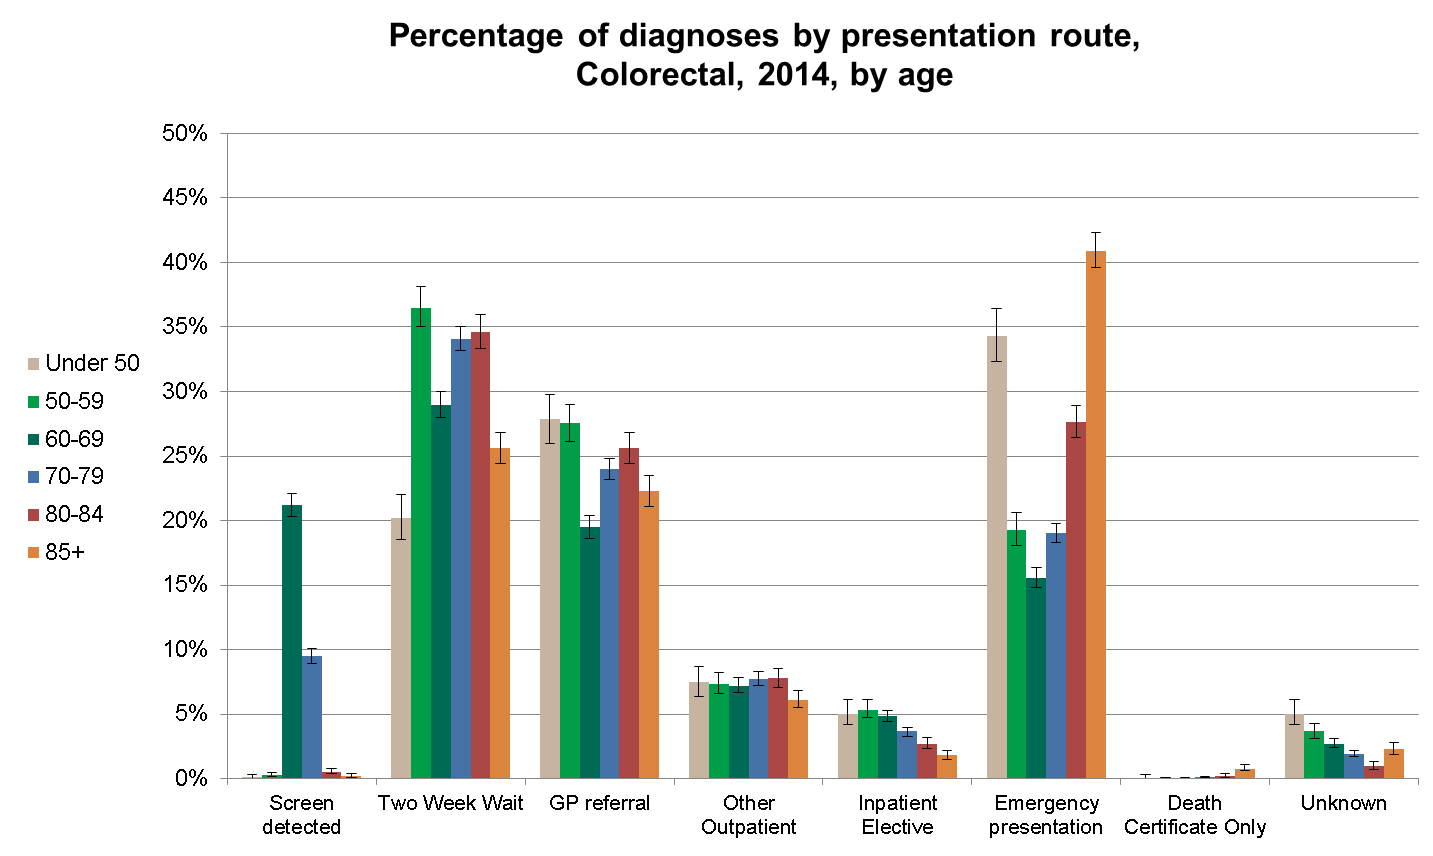
We can see from the new data that numbers vary widely and also over time, with 21% of bowel cancers in 60-69 year olds being picked up through screening in 2014, with more men than women being diagnosed via this route.
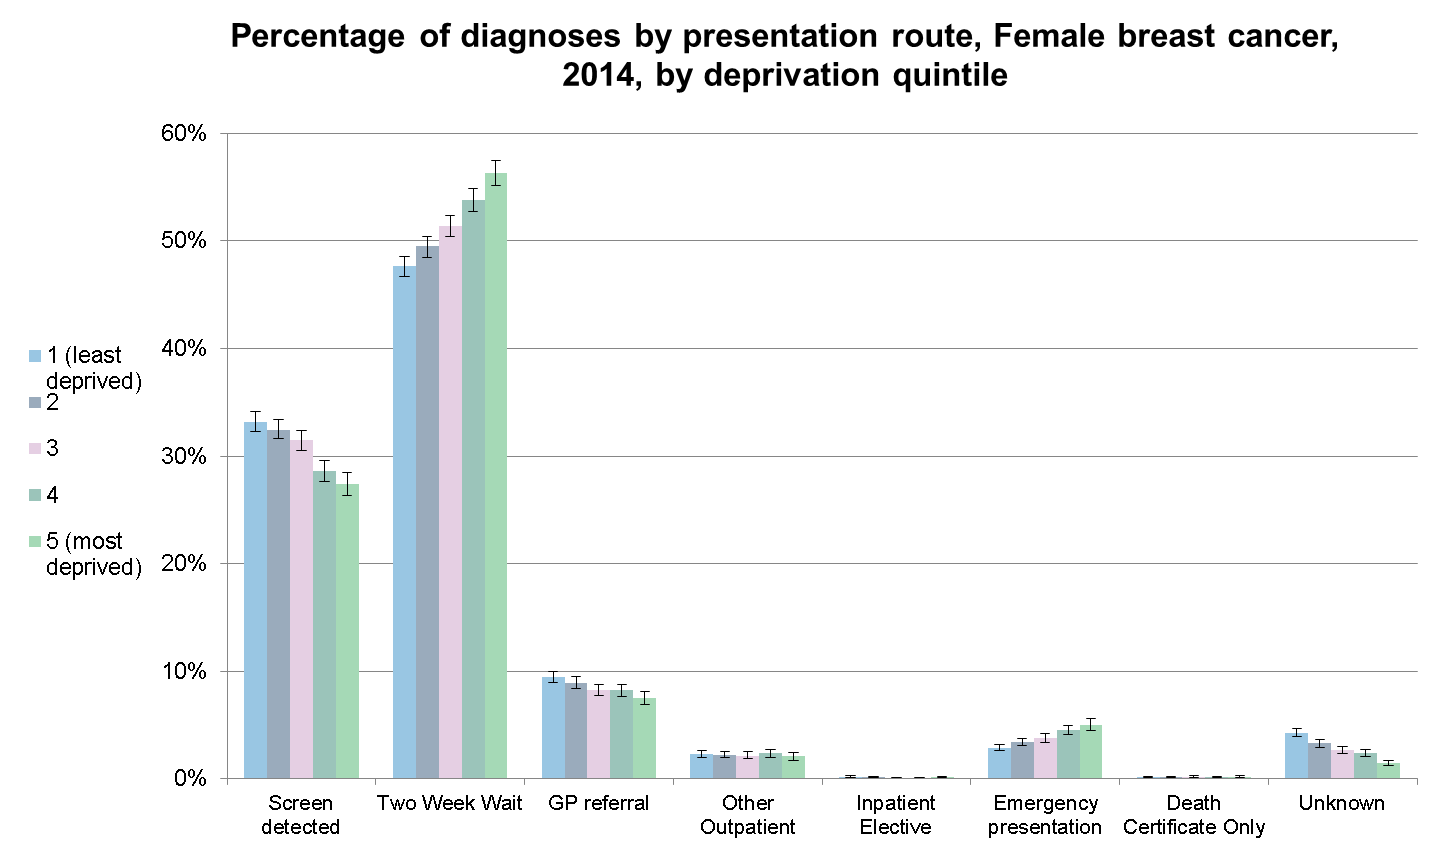
The data are broken down by deprivation group and this shows us big difference in proportions being diagnosed through breast screening, with more patients in the affluent group being diagnosed through this route.


Who should be using the data?
These data will help the NHS and Public Health colleagues better understand who is more likely to be diagnosed through different routes, and thus where we should target the development and evaluation of early diagnosis interventions with a public health or health-care focus, for example cancer awareness campaigns.
Researchers can make use of the updated data to examine and generate evidence about the nature of cancer diagnosis and how patients interact with primary and secondary care, where delays occur and why certain groups might be presenting later than others.
We are already working on the next update and plan to release ten year's worth of data, up to 2015, later this year.
Are you interested in public health data? Read more related blogs.
