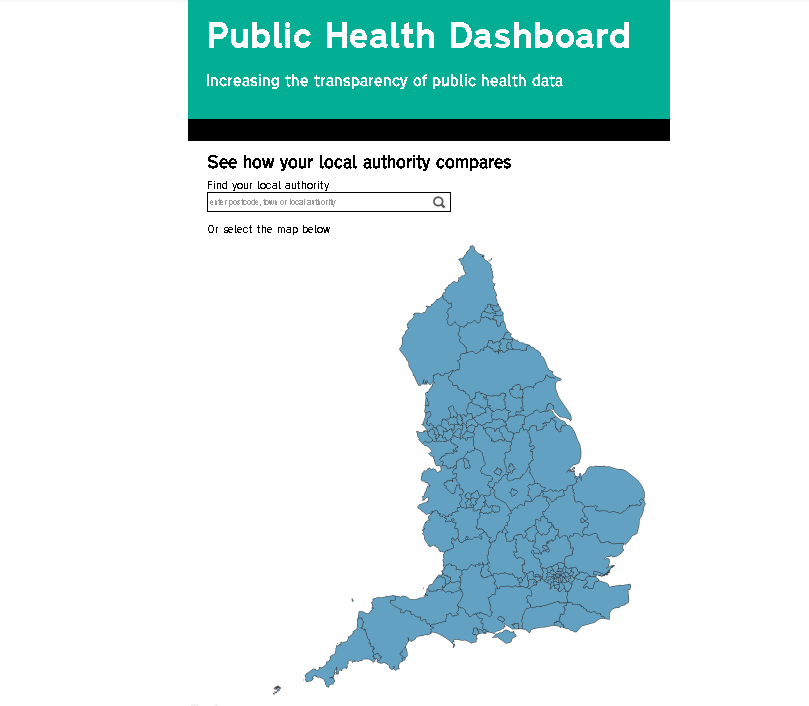
As part of a wider government commitment to support greater transparency across the public sector, PHE has published a new local authority public health dashboard. Our Deputy Chief Executive and Chief Operating Officer Richard Gleave answers questions about the project:
Who is the new dashboard aimed at and how will it be used?
The dashboard will support local councillors and senior council officers in making decisions on how they prioritise resources across a range of public health service areas. As a new tool, we are publishing an initial version now and seeking suggestions to improve it so that we can launch it in full in the summer of 2018. It uses existing published data and therefore complements the range of tools PHE provides to support local government in their role as the local leaders for the public’s health.
We think that this dashboard will be helpful in raising the profile of public health services locally and ultimately having a positive impact on health outcomes. So although the information is aimed at decision makers, the data is publicly available allowing local people to get better informed about their council’s public health services.
What sort of data is included?
The digital dashboard currently covers a range of service areas; best possible start in life, child obesity, drug treatment, alcohol treatment, NHS Health Checks, sexual health services and tobacco control.
The rationale for choosing these services is that:
- They are nationally prescribed but their local delivery is the responsibility of upper tier local authorities
- There is compelling evidence that action is important to health outcomes in every area of the country
- Delivery of these services will impact on future demand for other local authority services and the NHS
For each service area we have produced one combined (summary rank) indicator made up of several different component indicators. On the basis of this, in each of the seven areas of delivery each local authority has been given a ranking and description based on how it compares with all other local authorities with a similar deprivation index.
It’s important to mention that this dashboard looks at some outcomes achieved and proxies for outcomes, such as actual service levels, not inputs like local authority staffing or spend.
It’s also worth noting that this is a working version with indicators where there’s a clear relationship between council activity and delivery. We’re committed in the longer term to looking at indicators on some of the wider determinants of health and we’ll also consider a place-based approach to the indicator set.
If you’d like more detail we’ve published two detailed papers; one explaining the rationale for the indicators we have chosen and another explaining the methodology used to calculate the summary rank indicators.
Have factors like deprivation or rurality been taken into account?
The indicators are presented so that councils with a similar level of deprivation can be compared and further comparisons can be investigated by councils themselves using the further detail which is available in PHE’s online Fingertips tool. New indicators and new comparisons may be added to the dashboard over time.
Is this data being published for the first time?
No, this builds on information we already publish on Fingertips and myNHS so there is nothing in the dashboard that is not already in the public domain. We are simply summarising and showing comparable delivery to help councils and stakeholders understand how each council compares.
How will the dashboard help local authorities?
We believe it will be a helpful tool for local areas and allow directors of public health to raise the profile of key issues with councillors and residents, as well as supporting local discussions about resources and how they should be used.
What’s next for this project?
To date we’ve had discussions with LGA, ADPH and other national partners and local authorities themselves have had an opportunity to see their data in advance. We are keen to receive a wide range of views and feedback in order to refine the dashboard before it is launched in its final format next summer 2018 and subsequently published on an annual basis.
We are particularly interested to receive feedback on the following areas:
- The indicators within the dashboard
- The terminology used in the site including how the categories of performance are described
- How to improve the data quality and how to handle any gaps in the data
- Whether to include additional indicators on other wider determinants of health
- What additional support/resources it would be useful to publish alongside the dashboard to help local authorities act on the information it contains.
Please send any comments to PHdashboard@phe.gov.uk by 30 November 2017.
