

With more people than ever being diagnosed with cancer, there is a need to understand the current population of those living with and beyond cancer. Previous work has looked in detail at the prevalent cancer population at the end of 2010. More up to date data is needed to help give the best care to the growing population currently living with cancer. With the increase in both the number of people diagnosed with cancer as well as improving survival rates, this population is increasing rapidly. NHS cancer-specific health geographies, including clinical commissioning groups (CCGs), Cancer Alliances and National Vanguards, have been introduced to help transform cancer services in England by introducing accountability for the whole patient pathway. These organisations need data on patient demographics in order to support the delivery of care and understand the needs of the cancer patients under their care.
A new workbook released today provides a detailed update on the number of people living with cancer in England at the end of 2015 and presents the data by additional demographics and sub-national geographies. This work was carried out in partnership between the National Cancer Registration and Analysis Service (NCRAS) and the Transforming Cancer Services Team for London (TCST), part of Healthy London Partnership. This work was also supported by and builds on previous prevalence work carried out by the NCRAS partnership with Macmillan Cancer Support.
What is prevalence and how is it calculated?
Prevalence is defined as the number of people diagnosed with a disease during a certain time period who are still alive at the end of the period of interest. Data on people diagnosed with cancer (all tumours excluding non-melanoma skin cancer) from 1995-2015 who were alive on 31/12/15, were extracted from Public Health England’s national cancer registry to allow calculation of 21 year limited duration prevalence estimates.
For the first time we have been able to provide granular data on the number of people living with cancer by many different demographics including 22 individual tumour types, sex, the age at diagnosis, the age in 2015, ethnicity, deprivation, and stage at diagnosis by resident CCG, cancer alliance and region.
What do the results show?
There were 1.8 million people living after a diagnosis of cancer in England at the end of 2015, of which over 805,000 were male and over 985,000 were female. 39% of men and 30% of women living with cancer at the end of 2015 were 75 years or older. These results are somewhat expected given that there is an ageing population nationally, more people are surviving cancer and the number of people living with cancer who are 75 or older is expected to rise in years to come.
There is large regional variation in the cancer prevalence rate for all cancers. London has a substantially lower prevalence rate (2,420 cases per 100,000 population) than any other region, whilst South West has the highest prevalence rate (3,900 cases per 100,000 population).
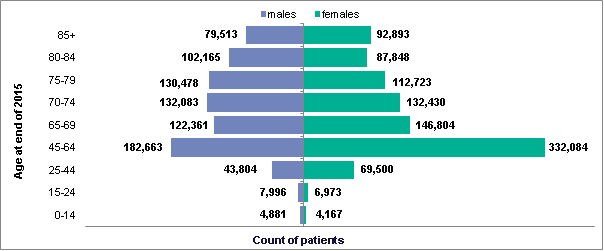
The age distribution of those living after a cancer diagnosis in England grouped by their age at the end of 2015
Of females living after a diagnosis of cancer, nearly half (48%) have had a diagnosis of breast cancer compared with 10% who have had a colorectal cancer diagnosis. Of males living after a diagnosis of cancer, 40% have had a diagnosis of prostate cancer and 15% have had a colorectal cancer diagnosis.
Of those living with a cancer diagnosis, 12% were diagnosed less than a year ago whilst the same proportion, 12%, had been living for more than 15 years since their diagnosis. The largest proportion of patients have been living between 5-10 years since their diagnosis (27%). These rates vary across tumour types with 89% and 1% of those with mesothelioma were diagnosed 0-4 and 15-21 years ago respectively, compared to 28% and 24% of those with cancer of the testis were diagnosed 0-4 and 15-21 years ago. These results suggest that prevalence was found to be lower for cancer types that have a low survival rate and a high incidence rate.
Further, it was also found that the distribution by tumour site of those diagnosed with cancer in 2015 was similar to the distribution of those living with cancer in 2015.
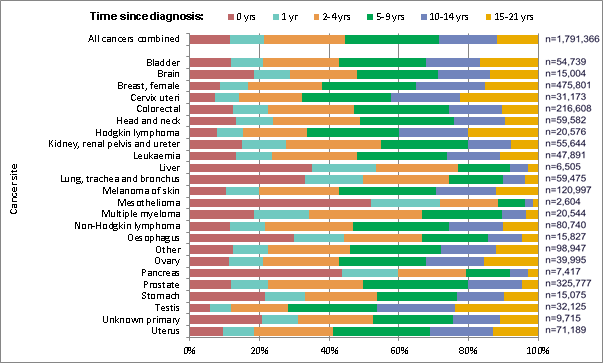
The distribution of the number of years people have been living with cancer since their diagnosis by tumour site
What next?
Utilisation of more recent cancer registration data has allowed for a more accurate understanding of the current population of people living with and beyond cancer in England. For example, use of this data by strategic transformation partners, clinical commissioning groups, local authorities, as well as trusts and alliances has supported service provision and helped identify unmet need, including in rehabilitation and psychological support services.
These granular results allow for an in-depth understanding of patients living with and beyond cancer at national, regional and local levels, including cancer-specific health geographies. This work supports the planning and future provision of health and social care services for people living with cancer.
Local authorities and CCGs may wish to use the workbook in preparing Joint Strategic Needs Assessments to support identification of unmet need. STPs and cancer alliances will also be able to use the prevalence data alongside their cancer plans, particularly those sections relating to living with and beyond cancer.
Next steps for the TCST/NCRAS partnership include looking into the prevalence population of those who have more than one cancer diagnosis. These patients have different needs and requirements to the majority of cancer patients with only one tumour, both through primary and secondary care, but also in support mechanisms that can be given in the community or through charities.
You can read our blog on the National Cancer Diagnosis Audit here.