

This is the latest in a series of blogs summarising what we learn each time we update the Public Health Outcomes Framework (PHOF). The latest update includes 20 indicators, some of which we explain below.
The PHOF includes a set of indicators that help us understand how well public health is being improved and protected. It aims to reflect a focus not only on how long people live, but on how well they live at all stages of life.
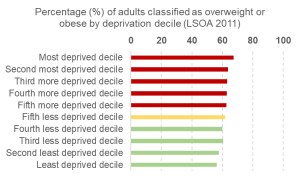
The proportion of overweight or obese adults has increased
Several indicators in the health improvement domain have been updated to the latest period of 2017/18 following the release of data from the Active Lives Survey by Sport England.
This shows that the percentage of adults (aged 18+) classified as overweight or obese (a body mass index of 25 kilograms per metre squared or greater) increased to 62.0% in 2017/18, up from 61.3% in 2016/17. Excess weight is a leading cause of type 2 diabetes, heart disease and cancer and reducing obesity is a PHE priority.
In each of the three time points for which the PHOF has comparable data, the percentage has consistently been higher for men than women.
There is also a clear trend across socio-economic groups. Communities with higher levels of deprivation have higher proportions of adults who are classified as overweight or obese.
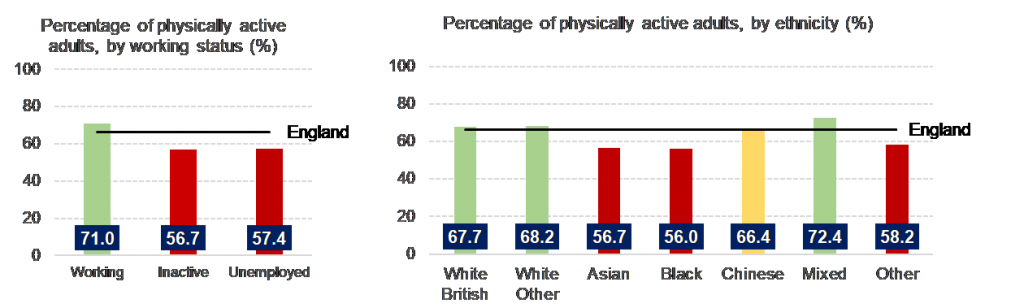
Levels of physical inactivity remain unchanged
Physical inactivity is one of the leading causes of disease and disability in the UK and is estimated to be responsible for one in six UK deaths (this is equal to smoking). Physical inactivity is defined as engaging in less than 30 minutes of moderate intensity physical activity a week. In 2017/18 the percentage of physically inactive adults was 22.2%, the same value as it was in 2016/17.
The percentage of physically active adults (those completing at least 150 minutes of physical activity a week) increased slightly, but not significantly, in 2017/18 to 66.3%. The proportion of physically active adults varies across demographic groups and is highest amongst those in work, and those of higher education levels. There is also variation across ethnic groups.
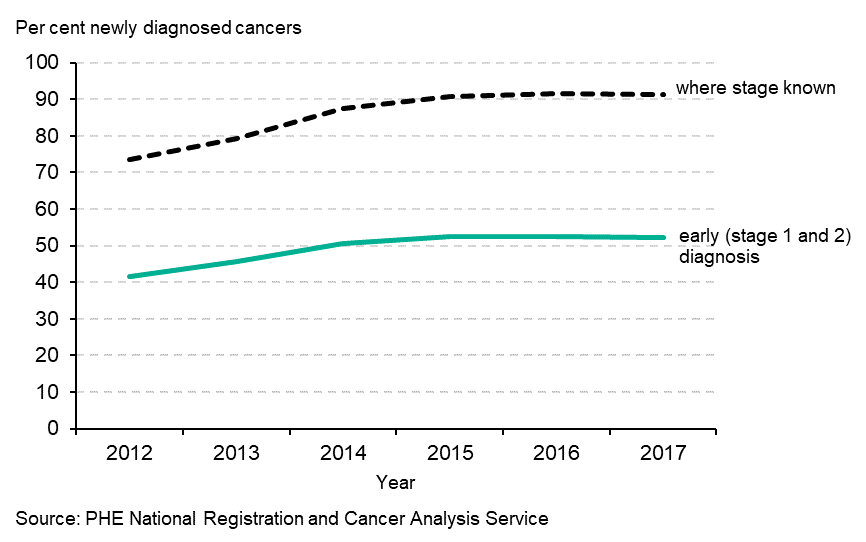
The proportion of cancers diagnosed at stage 1 and 2 has remained stable
Diagnosis at an early stage of the cancer’s development leads to dramatically improved survival chances. This is important when one considers that more than 1 in 3 people will develop cancer at some point in their life.
This indicator looks at new cases of cancer diagnosed at stage 1 and 2 as a proportion of all new cases of cancer diagnosed for specific cancer sites (invasive malignancies of breast, prostate, colorectal, lung, bladder, kidney, ovary, uterus, non-Hodgkin lymphomas, and invasive melanomas of skin).
The proportion of cancer diagnosed early did not change significantly in 2017 compared with 2016. It reduced slightly to 52.2% compared with 52.6% in the previous period.
This indicator is not red, amber, green (RAG) rated and is labelled as experimental statistics because of the variation in data quality: variation in the indicator values influence the variation in completeness of staging information.
Data for areas where fewer than 70% of the cases had known staging information are excluded from the indicator. The proportion of local authorities achieving 70% staging coverage increased substantially after 2012, the first year of data collection for this indicator and this is reflected in the national proportion which improved considerably between 2012 and 2015.
Another factor with an important effect is the case-mix of cancers diagnosed. For example breast cancer is far more likely to be diagnosed at an early stage than lung cancer, so areas with a high proportion of breast cancer will have better outcomes on this indicator in comparison with areas with a high proportion of lung cancer.
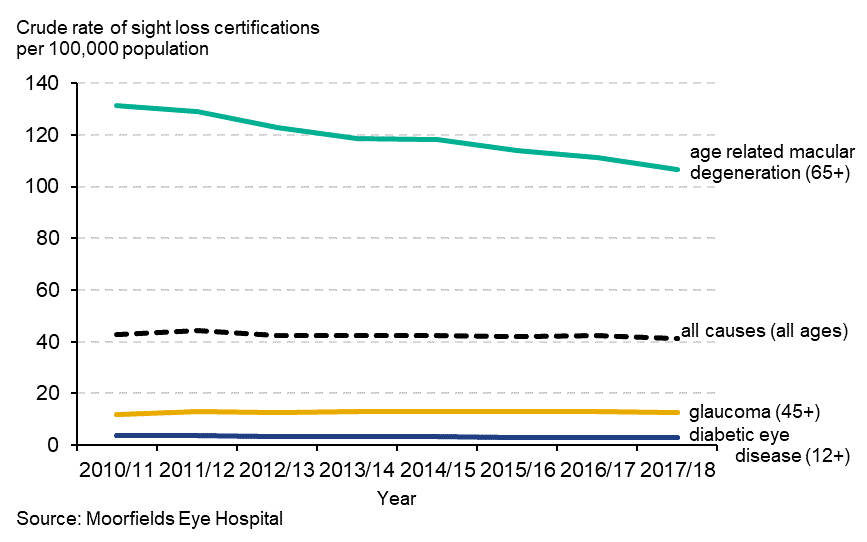
Preventable sight loss has decreased
The PHOF indicator on sight loss is calculated using data provided from Moorfields Eye Hospital, who are contracted by Department of Health and Social Care and the Royal College of Ophthalmologists to be responsible for certifications.
The indicator is split into four sub-indicators, which cover sight loss certifications from all causes (preventable and non-preventable) and the three most common causes of preventable sight loss:
- age-related macular degeneration (ages 65+)
- glaucoma (ages 40+)
- diabetic eye disease (ages 12+)
The latest data are for 2017/18 and are measured as the crude rate of new certifications per 100,000 population. The rates reflect 22,844 sight loss certifications in England, of which 10,699 were due to age-related macular degeneration, 3,485 were due to glaucoma and 1,332 were due to diabetic eye disease.
The rate decreased significantly for all certifications and those due to age-related macular degeneration compared with the previous time point (2016/17). The rates also reduced for certifications due to glaucoma and diabetic eye disease, but not significantly.
Visit the Public Health Outcomes Framework to see all of our indicators.