
What is Local Health?
Local Health presents indicators for small areas. Providing data for electoral wards and middle super output areas (MSOAs) allows users to look at variation in health within larger areas, such as local authorities and Clinical Commissioning Groups (CCGs). The tool has been updated, providing new data for small areas in England.
Local Health provides an understanding of the scale of inequalities within local areas, supporting targeted interventions to reduce health inequalities and ultimately serving to progress the aim for everyone to have the same opportunities to lead a healthy life, no matter where they live or who they are.
Local Health contains nearly 70 indicators, including key measures of health such as life expectancy, mortality, cancer incidence and hospital admissions. Also included are indicators to help understand the demographic characteristics of small areas, such as the age structure and ethnicity of their populations, as well as indicators based on the ‘wider determinants’ of health, including deprivation and unemployment, which lead to inequalities in health outcomes.
The tool can also be used by users to define their own areas. And there’s also no need to be constrained by the data included in Local Health as users can add their own.
What has been updated in Local Health?
The complete list of indicators that have been updated is available here. We’ve also updated the maps and boundaries used, meaning the updated tool provides around 700,000 new local values.
To accompany the long established Local Health tool, a profile in PHE’s Fingertips platform has also been released for the first time. This presents the small area data in a format which will be familiar to users of PHE’s other Fingertips profiles, such as the Public Health Outcomes Framework.
The two tools provide complementary functions. For example, while Local Health provides maps to visualise variation between small areas, the new Fingertips profile makes it easy to compare small area values for an indicator, and to see if differences between areas are statistically significant.
New indicators
In response to feedback from users, several new indicators have been added to Local Health in this update. Users identified indicators of musculoskeletal disease as a high priority, as these are a leading cause of ill-health. Indicators of back pain and severe back pain are therefore provided for small areas for the first time.
Within England as a whole, it is estimated that almost 17% of people suffer from back pain, but Local Health shows that this can be as high as 25% in some wards. Even in wards with the lowest prevalence, it is still around 10%. Prevalence of severe back pain in wards ranges from 5% to 18%.
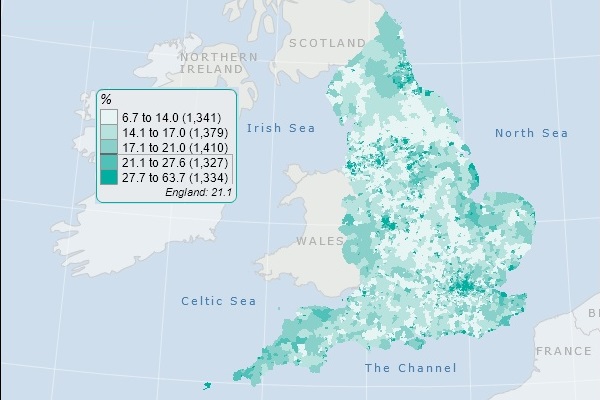
Local Health already includes indicators of deprivation and these are now complemented by a new indicator showing the estimated proportion of households in poverty in each MSOA. The map from Local Health below shows the scale of inequality within England, with estimates for MSOAs ranging from 7% to 64% of households in poverty (after housing costs have been considered).
A new mortality indicator has also been added to Local Health, to provide evidence of the level of preventable deaths. Deaths are considered preventable if all or most deaths from the underlying cause could potentially be avoided by public health interventions in the broadest sense. Deaths from lung cancer, for example, are considered preventable as the majority could be averted by interventions to reduce smoking.
Local Health shows considerable inequality in levels of preventable deaths between small areas in England. In 114 MSOAs, the level is less than half the average for England, yet in 172 MSOAs it is more than double the level for England.
Smoking at a young age can lead to poor health and early death, and the government’s ambition is to reduce the number of regular smokers at age 15 to 3% or less by 2022. To help monitor this, updated indicators of smoking prevalence at age 15 have been added to Local Health (based on survey data from 2014/15).
These estimates show that the current ambition is not being met in over 90% of wards. Furthermore, in around 4% of wards more than 10% of 15 year olds are regular smokers.
What’s next for Local Health?
During 2019, Local Health will have a software update, moving it away from its current Flash based systems. We hope this will improve the ‘look and feel’ of the tool, and it will also make it more easily available on mobile devices, allowing users the ability to use Local Health on the go.
How can I get help with Local Health?
If you have any queries or comments about the tool then e-mail us at localhealth@phe.gov.uk
We’d also welcome feedback on the updated tool in both the original format and the new Fingertips profile, and are keen to hear more examples of how Local Health is being used in practice.