
Keeping the public and leaders across government and the health care sector informed about the progress of the coronavirus pandemic is a critical part of controlling the spread of infection. That’s why, in April, we decided we needed to create a tool to bring all the essential data and statistics about COVID-19 in the UK together into one place.
And that became the COVID-19 dashboard.
To begin with the site was updated every day with numbers of cases and deaths. But over the past few months the breadth of data has grown, and the dashboard has become an essential tool for many, handling data from more than a dozen sources across all four nations of the UK.
It currently has over 300,000 unique users every day, and five million hits a week.
The dashboard now not only gives an incredibly detailed picture of what is happening on a national level – but also what is happening in your neighbourhood.
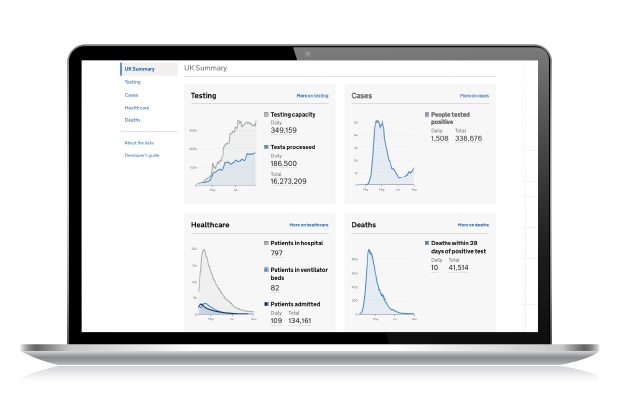
For instance, you can see how many people are being admitted to hospital and how many are on ventilators across the country, as well as data for cases, test and deaths.
But 300,000 people have also used the MSOA (Middle Layer Super Output Area) map, which allows you to type in a postcode to see how many cases there are in incredibly small areas of around 7,000 people.
These data are being updated daily so users can see what might be going on near their friends and family. They are also helpful for dealing with local outbreaks.
We recently posted a survey on the dashboard asking for feedback, and within 48 hours we had 17,000 responses. Users tell us they are even using the dashboard to make decisions about whether they should go on holiday to a certain area, visit a friend or get their hair cut.
We’re constantly updating the dashboard in response to user feedback, and we want to add even more detail. But it’s crucial to do that without giving away the identities of people who might have tested positive for COVID-19.
There is a careful balancing act between publishing as much information as possible because we want to be transparent and the need to protect privacy. Safeguarding deeply personal information is at the heart of any decision we make about how much detail to release.
Like any piece of software, the dashboard can occasionally have technical issues. There have been a few in recent weeks. And it can take time to sort out the issues and make the tweaks needed. With a small team of people working on it, that means on occasion the data has come out late.
But we are under no illusion about how urgent the need for data about this pandemic is for many people. Every day at 4pm, when we update the data, there are around 10,000 people online refreshing the page to see the latest totals.
Rest assured the team are working as hard as they possibly can on the other side of that mouse click to bring you the latest data.