The long term trend for mortality rates in England has seen them steadily fall over time, but in recent years there has been concern that they are not continuing to decline at the same rate, and some have suggested that they may even be increasing in certain groups.
Inevitably this leads to discussion and speculation about the factors which may be influencing recent trends.
This blog describes those trends and provides some evidence to contribute to discussion about what may be influencing mortality rates, which are key indicators of the nation’s health.
Additional evidence is also provided on life expectancy in the UK and other countries.
If mortality rates increase then life expectancy will fall, and vice versa.
Trends in the number of deaths and mortality rates since 2001
Mortality statistics are widely used to monitor progress against conditions such as heart disease and cancers, and on inequalities in health. In recent years interpretation of mortality trends has become more difficult.
Age at death has increased with two thirds of deaths now occurring at over 75 years.
As the population ages, the number of deaths appears to be less stable from year to year.
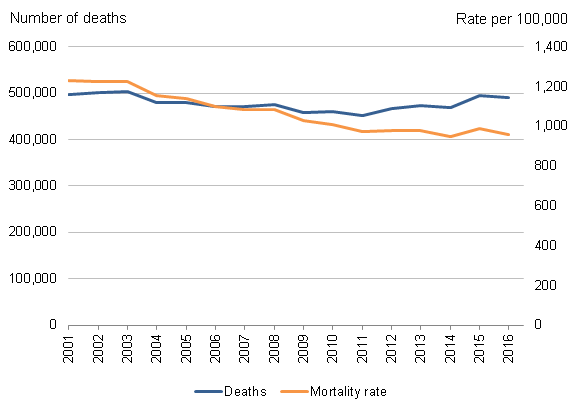
In 2001, there were around half a million deaths in England. The number tended to fall over the next decade and in 2011 there were just over 450,000 deaths.
At the same time England’s population increased and aged, both factors which would normally increase the number of deaths each year.
In 2004 Government Actuaries predicted that even if mortality rates continued to improve, the fall in numbers of deaths would end in around 2011/12 and they would then start to increase.
This turned out to be the case. Since 2011 the numbers have been generally increasing and by 2015 there were again just under half a million deaths in England.
A rise in the number of deaths does not necessarily mean mortality rates are increasing. Using ‘age-standardised mortality rates’ we take into account changes in the size and age structure of the population, to identify any change in the underlying rates.
Since 2001, there has been a general improvement in the age-standardised mortality rate. However, since 2011 the rate fluctuated more and the rate of improvement seems to be less than in the period from 2001 to 2011. There was also a clear increase in the rate in 2015.

Number of deaths and directly age-standardised mortality rate, England, 2001-16
Source: Office for National Statistics
We tested the level of change in recent years by creating a model based on mortality rates from 2002 to 2011. Rates were clearly falling in this period, which allows us to estimate the mortality rates we would expect had this downward trend continued.
The mortality rates in England between 2012 and 2014 were slightly higher than would have been expected if the earlier downward trend had continued unchanged. The rates for 2015 and 2016 were around 10% higher than we would expect.
Looking at all the evidence, it does appear that there has been a flattening off of the fall in mortality rates since 2011, which is not consistent with the trend in falling rates seen in the 10 years up to 2011.
But there is no evidence to suggest that the long term downward trend has reversed (in other words that rates are increasing).
What happened in 2015?
There were 495,000 deaths in England in 2015, just over 26,000 more than in 2014.
This was the biggest year-on-year increase in deaths since the 1960s.
ONS issued a provisional report on deaths in 2015, noting that there was a spike in deaths at the start of the year, which coincided with the peak in flu activity during the winter of 2014/15.
There was a significant increase in the mortality rate in 2015, with most of the ‘extra’ deaths that year seen in people aged 75 and over.
And there was a larger increase in female death rates than males, and most of the increase in deaths in people aged 75 and over was made up of deaths with a certified underlying cause of dementia/Alzheimer’s disease or respiratory diseases, including flu and pneumonia.
The reasons for the increase in 2015 have been the subject of much debate. We’ve been investigating potential factors, including the impact of population changes in more detail, and international comparisons, which add to evidence already reported by ONS.
Impact of population changes
Compared with the yearly average for 2010-14, there were about 30,000 more deaths in England in 2015.
Some of this increase could be expected because we know there were more older people in England in 2015 than in previous years.
We tested the impact of recent population changes by applying the death rates for 2010-14 to the population in 2015. Around two-thirds of the excess deaths in women in 2015, and all of the excess in men, could be explained by changes in the population size and age structure.
This means there were still almost 5,000 more female deaths than expected that could not be accounted for by population change alone.
This analysis illustrates the importance of taking changes to our population structure into account when looking at trends in mortality rates.
International evidence
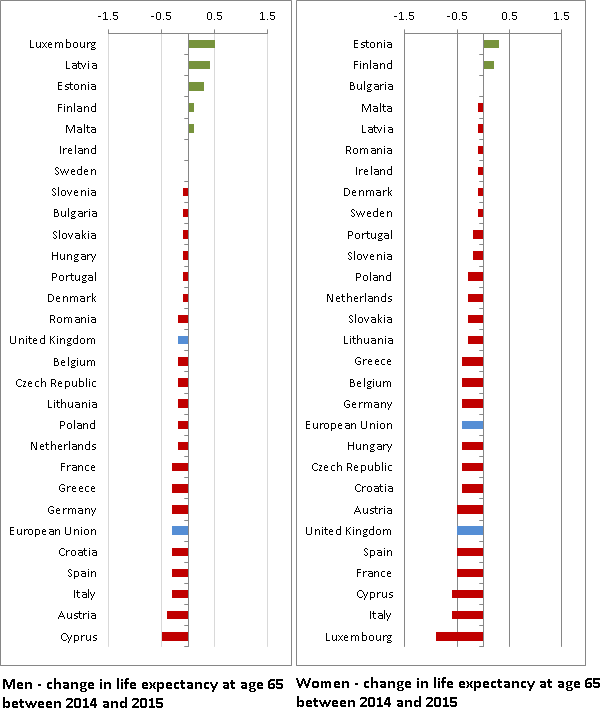
The increase in mortality rates in 2015 was not limited to England alone. It was seen across Europe on a comparable scale. The six biggest countries in the European Union (France, Germany, Italy, Poland, Spain, UK), all saw a fall in their life expectancies for both sexes.
Compared with 2014, in 2015 female life expectancy at birth fell in 23 of the 28 countries in the EU and male life expectancy at birth fell in 16 EU countries.
In contrast, when 2014 was compared with 2013, only 2 countries had a decrease in female life expectancy, and 5 had a decrease for males.
Even more countries had falls in life expectancy at older ages in 2015. For females, life expectancy at age 65 fell in 25 EU countries, and it fell in 21 countries for males.

Source: PHE analysis of Eurostat data
These data from Eurostat, the EU agency for European statistics, support what has been reported elsewhere by European statistical agencies: increased mortality in 2015 which disproportionately affected older people, and older women more than older men. Additionally, many countries reported an increase in deaths in the early part of 2015. The United States also reported a fall in life expectancy of 0.1 years in 2015.
This international evidence suggests that whatever factors caused the increase in deaths in England in 2015, also affected many other countries.
Influenza
PHE have previously reported that moderate levels of influenza activity were seen in the community in the UK in 2014 to 2015, with influenza A (H3N2) the predominant virus circulating for the majority of the season, the impact of which mainly affected the elderly. Low vaccine effectiveness was seen in 2014/15 which was likely to reflect the mismatch between the viruses which were circulating and the main strain which had been included in the flu vaccine formula.
The impact of flu across Europe has also been reported indicating that influenza circulation was an important driver of excess mortality in the winters of both 2014/15 and 2016/17.
What’s happened since 2015?
A provisional report from ONS indicates that in 2016, life expectancy for both sexes in England increased from 2015 levels, and for men was back to the historically high value of 2014.
Final figures from ONS show that the age-standardised mortality rate in England improved in 2016 compared with 2015 and was the second lowest rate since 2001 (the lowest being in 2014).
Between 2015 and 2016, the rate decreased by 2.9% for females and 2.6% for males.
There were also fewer deaths at ages 75 and over.
Likewise, provisional data released by France, Italy, and Sweden show that even when the number of reported deaths in 2016 were relatively similar to the year before, life expectancy has recovered to or surpassed its 2014 values.
ONS have also provisionally reported on deaths in England in the first quarter of 2017, showing that the number of deaths at the start of this year was higher than the average of the first quarters of the previous five years, but lower than 2015.
This higher than average level of deaths cannot yet, with certainty, be attributed to specific causes, but the very cold weather that we experienced at the beginning of the year and the strains of flu that were circulating (A/H3) are likely to have been contributing factors.
In the future
We cannot yet say what will happen to the trend in the mortality rate in the future. There is not enough evidence to help predict whether it will revert to its former downward trend, continue to fluctuate or even increase. But PHE will continue to closely monitor trends in mortality rates and life expectancy in England, and internationally, and work with our partner agencies and academic colleagues to investigate and report on the factors that may be driving changes.
Health Profile for England
This blog is one of a series linked to the Health Profile for England, a report combining data and knowledge on the health of the population in England in 2017. View the publication on GOV.UK or read other blogs discussing the issues the report raises.

2 comments
Comment by Harvey Neve posted on
a very interesting and thought provoking piece. Great seeing data being used to create insight and to identify questions and hypothesis for further research.
Thank you Faith for investing your time to undertake this work and to write this blog.
Comment by Eleanor Short posted on
Could you please indicate whether there has been any impact from the Fukushima nuclear accident and also whether any projections have been done to assess the impact of the Fukushima radiation on the UK population moving forward? Thanks.