
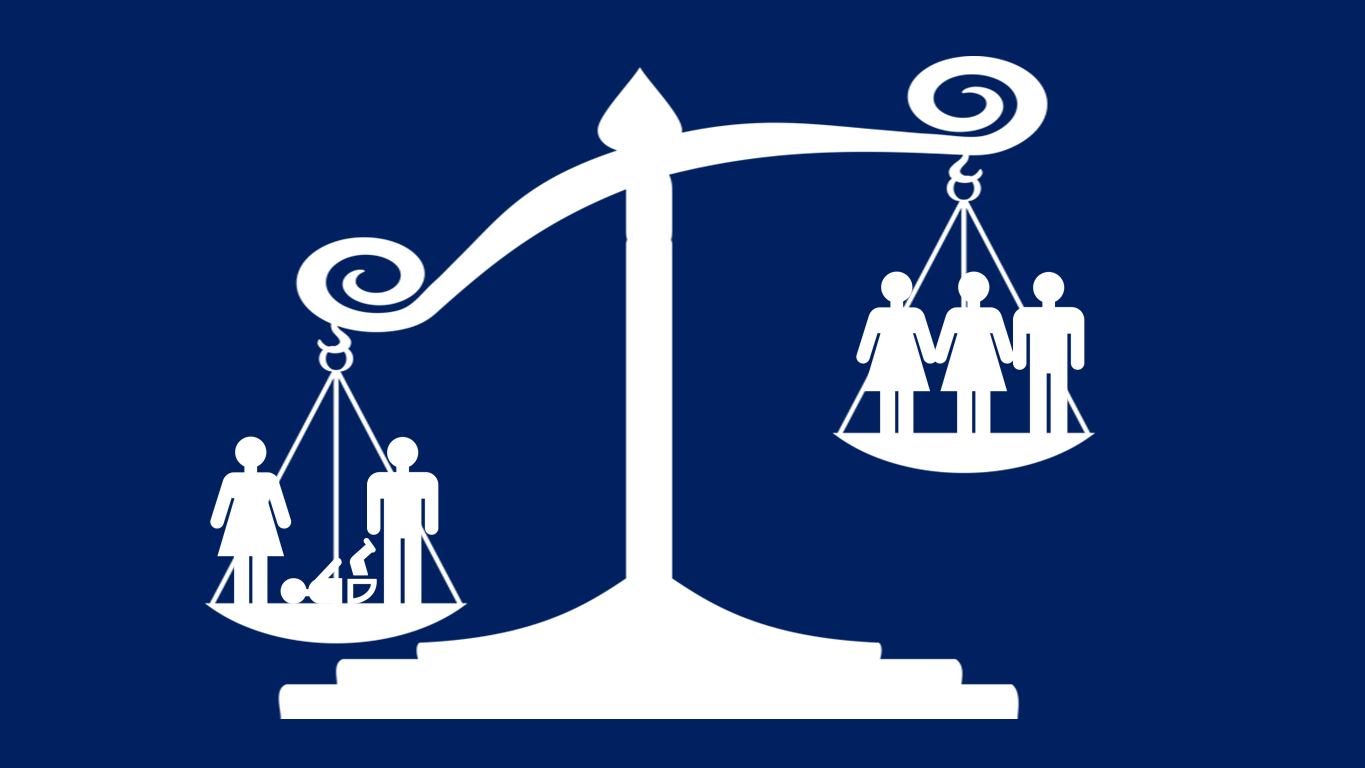
Reducing health inequalities means giving everyone the same opportunities to lead a healthy life, no matter where they live or who they are.
Currently, in England, people living in the least deprived areas of the country live around 20 years longer in good health than people in the most deprived areas.
So to tackle these inequalities we must give even more attention to those who are at greatest risk of poor health if we want to make an impact.
To help health and social care organisations understand and address health inequalities, we’ve published a new Health Equity report.
There are big inequalities in the health of different ethnic groups
Inequalities exist across a range of dimensions, such as socio-economic deprivation and personal characteristics like age and sex.
These are covered in the report, but we’ve placed a special focus on inequalities between ethnic groups and see major differences in health behaviours and outcomes between them.
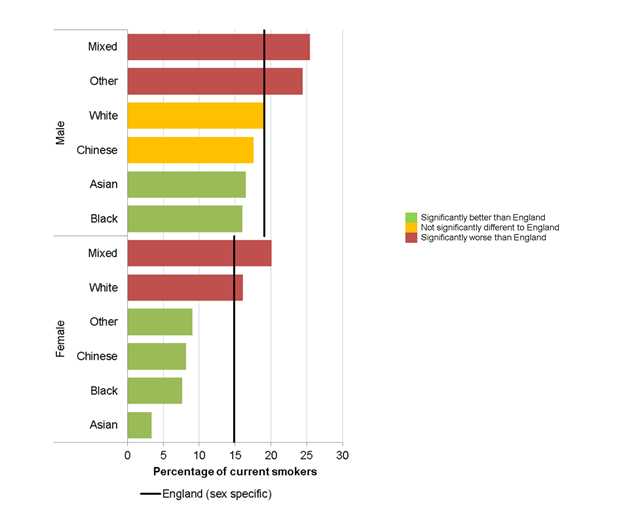
One example is smoking, a key driver of poor health and premature mortality. The report includes data on smoking prevalence by ethnic group broken down by sex.
This shows considerable inequality: 25% of men in the ‘Mixed’ ethnic group smoke, while only 3% of Asian women smoke.
A higher level of deprivation is consistently related to poorer health outcomes.
New analysis in the report shows that some ethnic groups are far more likely to live in more deprived areas than others.
Over 50% of people in the Bangladeshi and Pakistani ethnic groups lived in the most deprived 20% of areas in England in 2011.
Early years of life are key to reducing health inequalities
Giving children the best start in life is a fundamental part of improving health and reducing health inequalities.
There has been progress in a number of factors that affect children and their long-term health, with an overall improvement in the percentage of children who are not ready for school at the end of reception year.
This is not the same for all groups though, with a much higher percentage of children from Gypsy/Roma or Traveller of Irish Heritage groups not ready for school.
Poverty can have an impact on children’s ability to learn and we continue to see high rates of children living in low income families, most of whom are especially concentrated in deprived areas of England.
There are also big inequalities between ethnic groups, with the highest proportion of children living in low income families in the Bangladeshi and Pakistani ethnic groups.
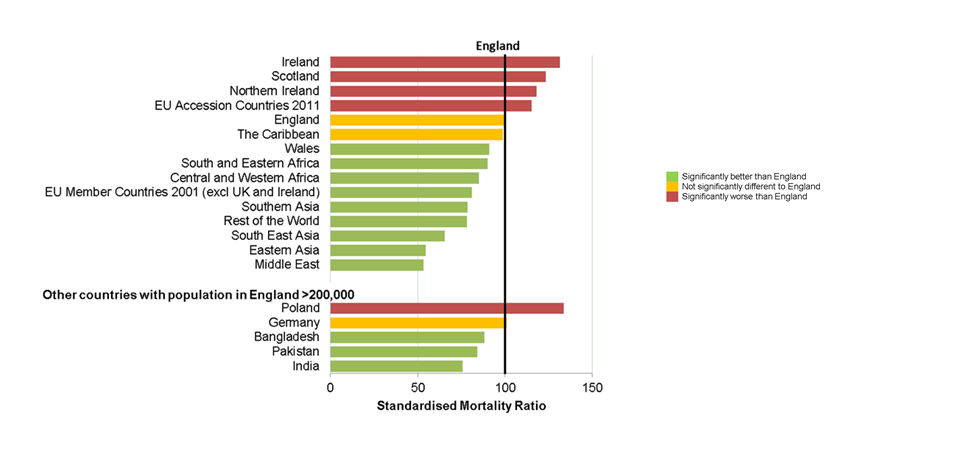
Among English residents, death rates vary considerably by country of birth
There is a 9 year gap in male life expectancy between the most and least deprived areas of England, and a 7 year gap for females.
There has been little change in this gap for men since 2010-12 and a small widening of the gap for women.
While we do not have information on life expectancy for different ethnic groups, information on where people are born can start to shed light on the role that different early experiences have on health.
Our report shows that people who live in England, but who were born in Scotland, Ireland or Northern Ireland, have significantly higher than average mortality rates for both deaths at all ages and premature deaths under age 75. They also have high premature mortality from cancer and cardiovascular disease.
Men born in countries which joined the EU between 2001 and 2011 (mainly the Baltic states and countries in Eastern Europe, including Poland) have high premature mortality rates, but the same is not true for women from these countries who are doing better than average.
Men born in these countries have the highest premature mortality from cardiovascular disease, and the highest suicide rate.
PHE’s support for progress in reducing health inequalities
Action on inequalities is embedded into projects right across our organisation and we’ve looked to the Marmot review ‘Fair Society, Healthy Lives’ to inform our work.
This includes the publication of guides to help local areas translate Marmot principles into action.
A key element of Marmot is giving children a good start in life and our materials provide guidance on parenting and transition to schools, as well as movement into work.
We have also been promoting a Health in All Policies approach alongside the Local Government Association to help local government improve wellbeing and growth through its multiple functions.
And our Healthy Places programme has ensured that we are an active collaborator in the Housing and Health partnership and we promote good spatial planning for health.
Working with communities has benefits for improving health and reducing health inequalities.
Starting conversations with communities can be difficult and so we have published a how-to guide on engagement and a range of further information on working with communities.
PHE supports local areas on risk factors such as smoking, with targeted effective interventions on reducing rates of smoking in deprived areas, including a focus on reducing smoking in pregnancy and in mental health settings.
And we have also published 'Smoking Cessation: A briefing for midwifery staff' and launched an online training module, 'Very brief advice on smoking for pregnant women'.
Finally, our national marketing campaigns, such as the successful ‘Stoptober’ mass quit month and the ‘One You’ campaigns have a specific focus on the socio-economic groups most likely to have the poorest health.
We will continue to produce resources for local areas to help them reduce health inequalities and monitor progress via our data sources.
Health Profile for England
This blog is one of a series linked to the Health Profile for England, a report combining data and knowledge on the health of the population in England in 2017. View the publication on GOV.UK or read other blogs discussing the issues the report raises.
2 comments
Comment by Amanda Lawson posted on
There are always more takeaway food outlets in deprived areas which must be a factor in contributing to the higher number of people in those areas leading unhealthy lifestyles.
Comment by Nathanial Sergent posted on
Thanks for Sharing