
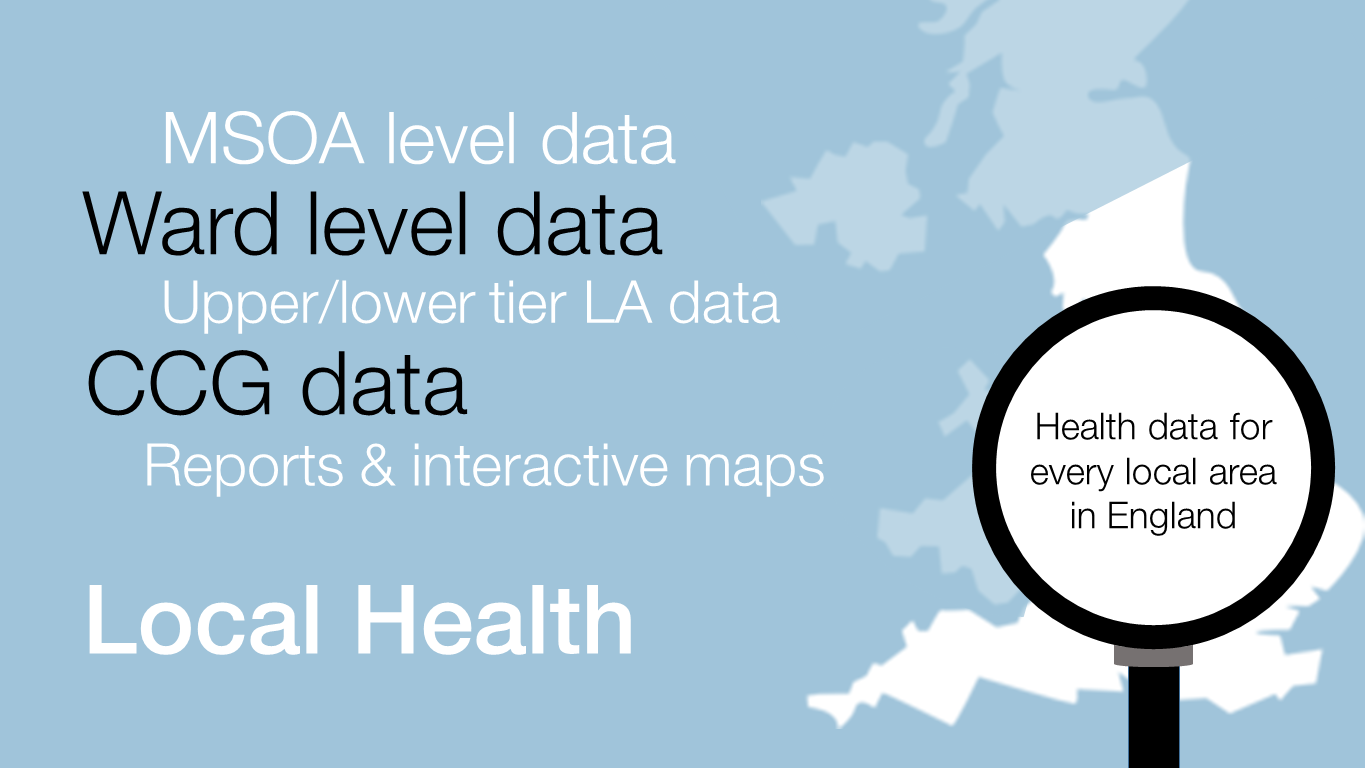
Local Health provides indicators for small geographies (electoral wards and middle super output areas) which allow users to look at variation within larger areas, such as local authorities and Clinical Commissioning Groups (CCGs). Our tool has been updated, providing a host of new data for small areas in England.
The tool provides an understanding of the scale of inequalities within local areas, supporting targeted interventions to reduce health inequalities and ultimately serving to progress the aim for everyone to have the same opportunities to lead a healthy life, no matter where they live or who they are.
Local Health now contains over 70 indicators, including key measures of health such as life expectancy, mortality, cancer incidence and hospital admissions. But it also contains indicators to help understanding of the demographic characteristics of small areas, such as the age structure and ethnicity of their populations.
There are also indicators of the ‘wider determinants’ of health, including deprivation and unemployment, which lead to inequalities in health outcomes.
What’s new in Local Health?
Every indicator which could be updated in Local Health has been. We’ve also updated the boundaries used so data are now available for 2016 electoral wards and 2017 CCGs. Where indicators could not be updated (e.g. measures based on the 2011 Census) we’ve provided data for the latest boundaries wherever possible.
There are almost 7,500 wards in England and around 6,800 middle super output areas. Along with data for local authorities and CCGs, this means the updated tool provides around 900,000 new local values.
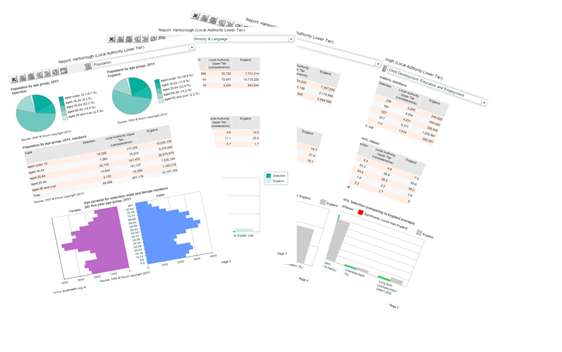
Users of the tool told us that they would like to have easier access to the underlying data in Local Health so we’ve made that possible in this update. Data can be downloaded in bulk for each of four Local Health theme groups, and data for wards have also been grouped together, so it is now possible to download all of the ward-level data in the tool by clicking on Data Download Files on the Home page.
Very few changes to the indicators have been made in this update, but we’ve added a new measure of fuel poverty. The drivers of this (low income, poor energy efficiency and energy prices) are strongly linked to living at low temperatures, which is associated with a range of negative health outcomes.
Some wards in England have as few as 2% of households experiencing fuel poverty, but in some wards it’s over 30%. Local Health can now be used to map such inequalities, highlighting for example, how neighbouring wards in the same local authority can have very different levels of fuel poverty.
How is Local Health being used?
Users of Local Health have given us many examples of how they are using the tool to map inequalities and explore variations between small areas. Outputs from the tool have been used for Joint Strategic Needs Assessments, supporting funding bids, service reviews, and formulating public health strategies.
The tool provides detailed profiles for electoral wards and so is widely used for informing elected council members. In Blackpool, for example, links to these ward profiles have been placed within its Joint Strategic Needs Assessment
Local Health is an ideal tool for visualising data. Besides maps, the tool can also be used to generate ‘spine charts’ to show, at a glance, how an area is doing across a wide range of indicators.
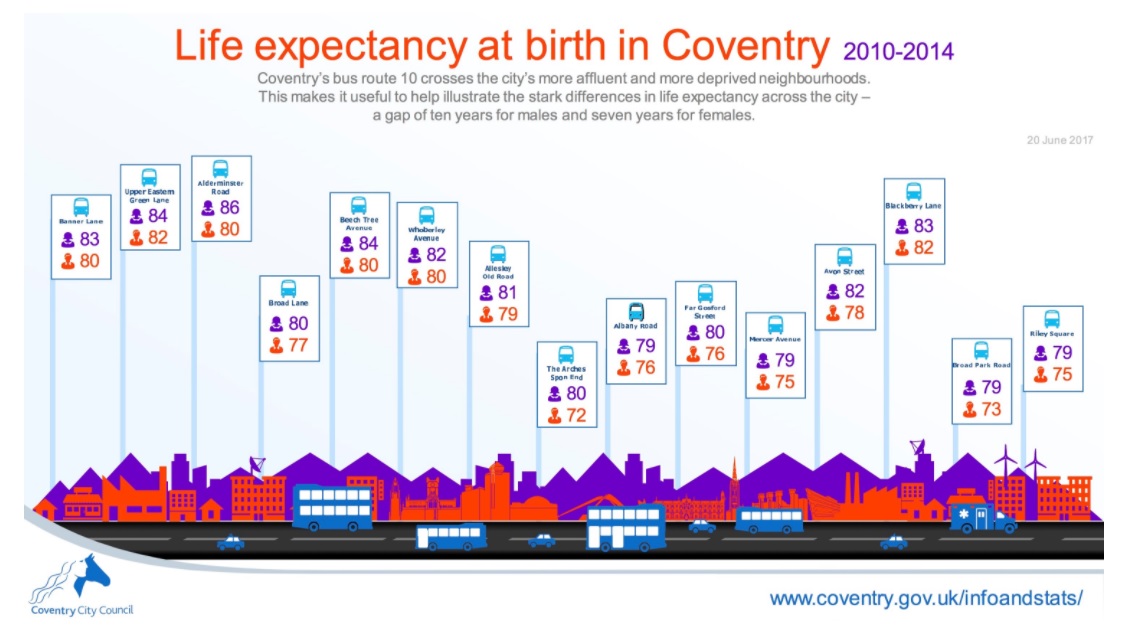
Data from Local Health have also been used to create inventive visualistions of inequalities within areas. In Coventry, for example, life expectancy data from the tool has been used to illustrate stark differences between deprived and more affluent areas in the city. For areas served by the Number 10 bus there is a difference in life expectancy of 10 years for males and 7 years for females.
What else can I do in Local Health?
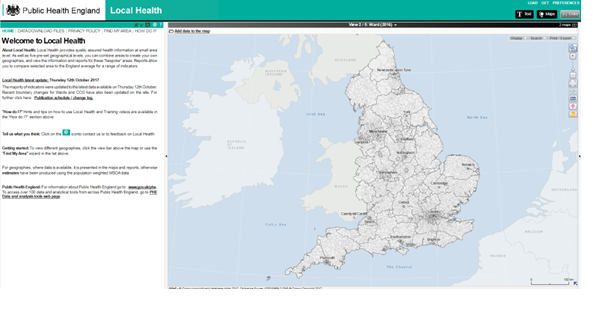
Local Health is freely available and there is a wealth of data to explore. New users could go to the Home page click on Find My Area and start to find out how the ward they live in compares with its neighbours.
Besides providing data for current wards and middle super output areas, Local Health also allows users to create their own geographies. By simply clicking on a map, users can create their own bespoke geographies. E.g. the most deprived areas within a local authority can be grouped together, even if they are not next to each other geographically. The tool can then provide statistics and reports for these new areas.
There’s also no need to be constrained by the data we’ve included in Local Health as users can also add their own data. Watch this training video in the tool for a step-by-step guide on how to do that.
Besides the core geographies in Local Health (wards, MSOAs, local authorities and CCGs) boundaries can also be added for additional areas, including Combined Authorities and Sustainability and Transformation Partnerships.
How can I get help with Local Health?
If you have any queries or comments about the tool then e-mail us at LocalHealth@phe.gov.uk
We’d also welcome feedback on the updated tool and are very eager to hear more examples of how Local Health is being used in practice.