This is the fourth in a series of blogs summarising what we learn each time we update the Public Health Outcomes Framework (PHOF).
PHOF allows us to make informed decisions based on data showing where we stand right now, but also allowing us to track progress.
It covers the full spectrum of what we understand as public health, presenting local authority data for many different health indicators and their determinants as well as offering professionals the chance to look at the national picture.
Our November update includes a new data source and definition for the indicators of diet and excess weight for adults.
The method used to calculate smoking in pregnancy has also been revised and a further 38 indicators have been updated, including sickness absence, homelessness and fuel poverty.
TB incidence and treatment have also been updated, along with mortality rates for a variety of causes.
The rate of preventable mortality fell to a new low
The rate of mortality from causes considered preventable* fell to the lowest levels recorded in the PHOF. However, the rate of 182.8 deaths per 100,000 in 2014-16 represented over 90,000 preventable deaths each year.

Premature mortality from CVD and cancer fell/premature mortality from respiratory diseases rose
There was a continued fall in the premature mortality rate from cardiovascular disease (including preventable cardiovascular disease) and from cancer (including preventable cancer) in 2014-16.
These reductions were seen in the rates for males and females separately, although the rates for males were significantly higher than for females.
Rates of premature mortality from respiratory disease increased in 2014-16, along with the premature mortality rate from respiratory diseases considered preventable.
The mortality rate from communicable disease, including influenza, increased in 2014-16, although not significantly. Over 5,000 deaths occurred each year from these diseases, with the rate for men higher than that for women.
The suicide rate fell in 2014-16, although not significantly. The rate for men was higher than for women, with over 3,500 deaths for men, which is more than three times the number for women.

Reduction in sickness absence
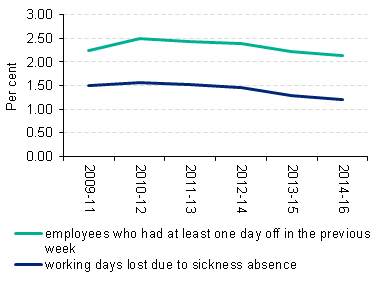
The percentage of working days lost due to sickness absence improved in 2014-16 compared with 2013-15, reducing by 0.1 percentage points to 1.2%. The percentage of employees who had at least one day off in the previous week also fell, but not significantly, to 2.1%.
New definition for smoking in pregnancy indicator shows reduction
The indicator of smoking status at time of delivery for mothers has been revised so that mothers with an unknown smoking status are not included in the denominator. The intention is to encourage reporting of smoking status as previously the unknowns would be effectively categorised as non-smokers. The latest data shows a continued reduction in smoking in pregnancy.
Seven percent of 15-year olds smoke regularly
The smoking, drinking and drug use among young people survey estimates that in 2016, 7% of 15 year olds smoked regularly, whilst 8% were occasional smokers. The percentage of regular smokers reduced from 8% in the previous survey in 2014, but not significantly, whereas occasional smoking increased from 5%.
Diet and excess weight indicators have been updated to use a new survey – the Active Lives Survey
In 2015/16, it was estimated that 56.8% of adults ate the recommended 5 portions of fruit and vegetables on a usual day. It also estimated that 61.3% of adults were classified as overweight or obese. The primary purpose of this survey is to provide local data, so the national values should be treated with caution, as more robust methods have been applied in other surveys to provide more reliable estimates for England.
Increase in deaths from drug misuse
The rate of deaths from drug misuse rose in 2014-16 to the highest recorded rate (data back to 2001-03).
Interested in health data? Read other relevant blogs.
*those causes which in the light of the understanding of the determinants of health at the time of death, all or most deaths from the underlying cause could potentially be avoided by public health interventions in the broadest sense

