Our new Health Inequalities in Health Protection report provides a high-level summary of the current state of health inequalities in England caused by infectious diseases, as well as environmental health hazards.
Some sections of society have poorer health than others. Most strikingly, people from the most affluent areas of the country will have almost 20 more years of healthy life than those in the most disadvantaged areas. This is a central …
Liver disease has changed over the years but my commitment to reducing deaths hasn’t. I’ve had a fascination and passion for treating and preventing it since I was a medical student, training at the Royal Free School of Medicine under …
Conversations about public health may have flowed over coffee yesterday (16 Sep), but they also took place online. On Twitter alone more than 1000 people got involved, Tweeting over 4000 times using the #PHE2014 hashtag. This blog provides a brief snapshot …
We all know there can be huge gaps in life expectancy experienced between different stops on the tube or an equivalent bus route, in Bath or Blackpool, Plymouth, Coventry, Nottingham or Sheffield. Familiarity with these gaps can dim their power …
...has many economic, social and cultural assets that are enjoyed widely by many, but unfortunately not by all. The figures are stark. In terms of economic assets, 30% of London’s...
...with their communities on health inequalities. These documents can be taken, used and shared by any public health professional or local authority colleague looking to discuss health inequalities with their...
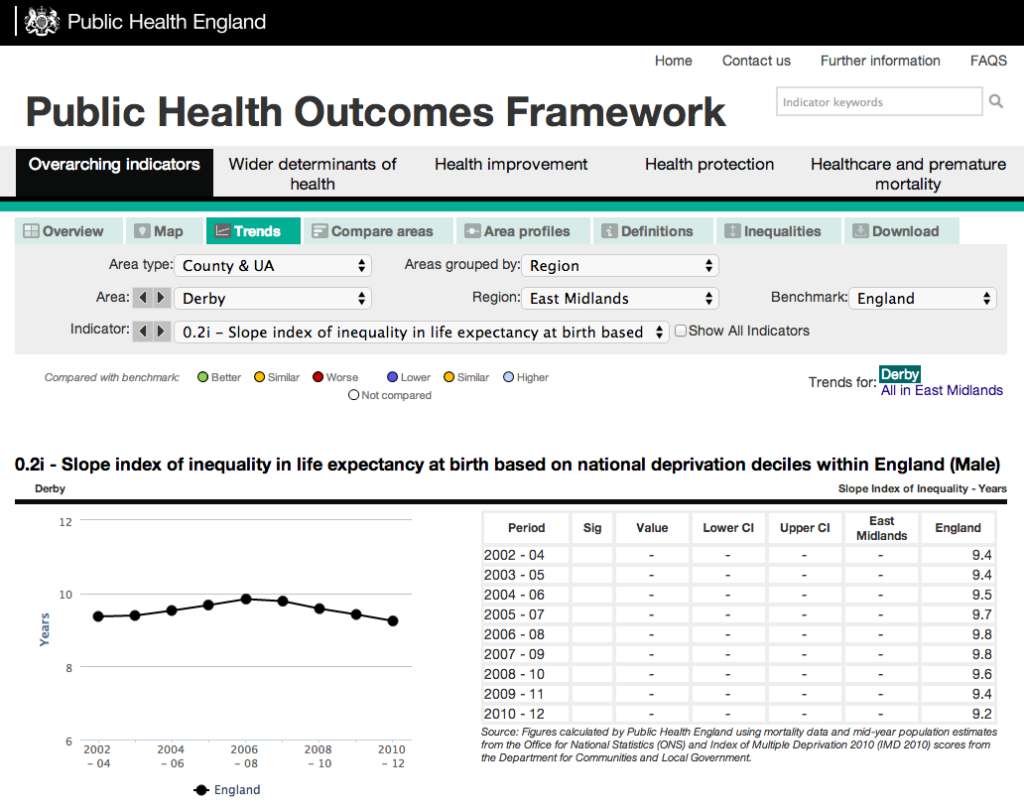
...and life expectancy at the bottom of the line. A similar chart can be drawn for female life expectancy. The SII represents the range in years of life expectancy across...
...intelligence works along much the same principle of asking lots of questions - not just about the state of a population’s health but also about the factors that help shape...
