
This is the latest in a series of blogs summarising what we learn each time we update the Public Health Outcomes Framework (PHOF).
The PHOF sets out a vision for public health, desired outcomes and the indicators that will help us understand how well public health is being improved and protected.
The outcomes reflect a focus not only on how long people live, but on how well they live at all stages of life.
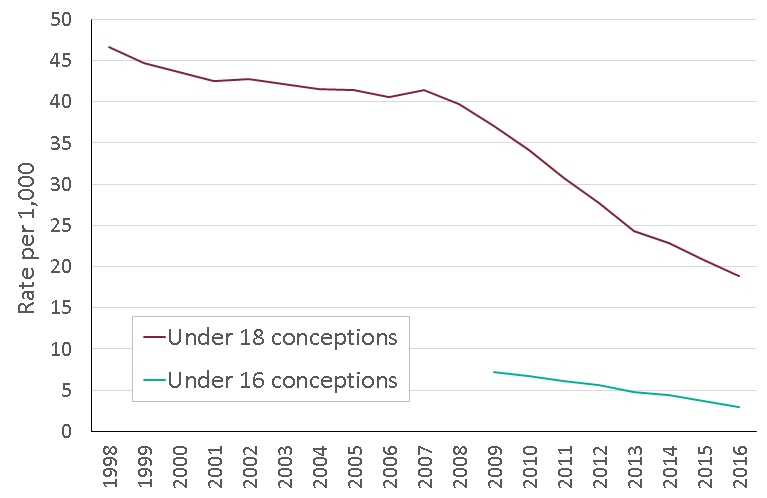
Conception rates for under 18s and under 16s fall to record lows
Both the under 18 and under 16 conception rates fell from 2015 to 2016. These both showed a continuing long term decline, to the lowest rates on record.
The under 18 conception rate has declined by 49% since 2009, to 18.8 per 1,000 females age 15-17 in 2016. The under 16 conception rate meanwhile has reduced by 59% since 2009, from 7.3 per 1,000 females aged 13-15 to 3.0 per 1,000.
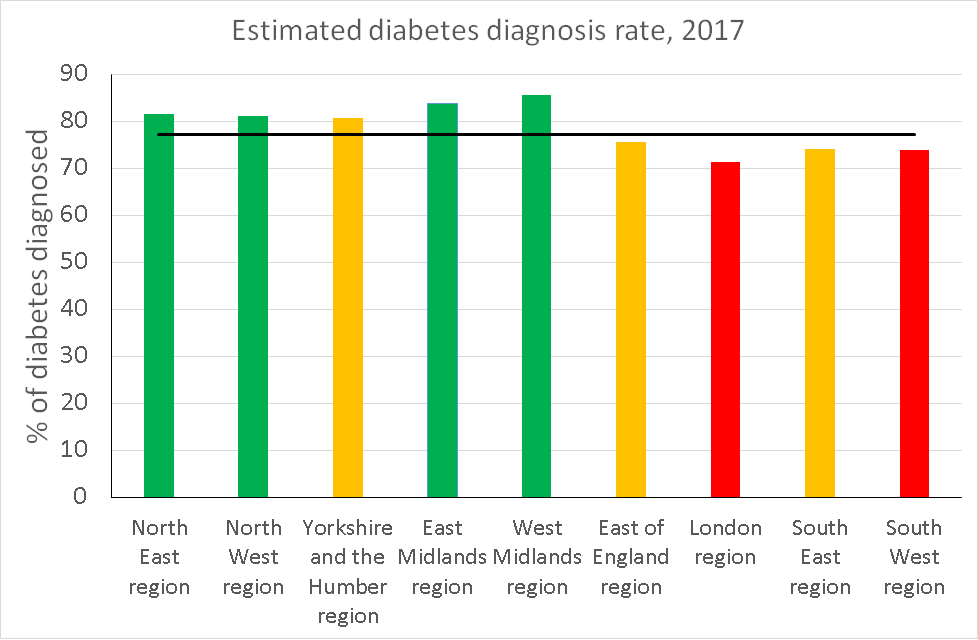
A new indicator, including trend data, of the diabetes diagnosis rate estimates 77% of cases are diagnosed
For this update, we’ve added a new indicator, measuring the proportion of the estimated population with diabetes who have received a formal diagnosis.
This indicator has replaced the original diabetes indicator in the PHOF, which just measured the level of recorded diabetes. The original indicator was found to be difficult to interpret since not all cases of diabetes are recorded.
The new indicator is easier to interpret. A value close to 100% indicates a small gap between the formally diagnosed prevalence and the estimated prevalence. It indicates that the system is good at proactively identifying people with diabetes.
Also added to the tool are historic data for this indicator. The estimated diagnosis rate was 77.1% in 2017, an increase from 76.2% in the previous year, although this increase was not statistically significant.
Over 19 years difference in healthy life expectancy between the most deprived and least deprived
Inequality in healthy life expectancy in the PHOF is estimated using a summary measure called the slope index of inequality (SII). The higher the value of the SII, the greater the inequality within an area.
The inequality in healthy life expectancy between the most deprived and least deprived areas in England was 19.1 years for both males and females in 2014-16.
For males, this was an increase from 18.9 years in 2013-15, whereas for females it was a decrease, from 19.6 years. However, neither change was statistically significant.
If you’d like to view the data for your local area, visit our webtool at www.phoutcomes.info, and if you’d like to send us any feedback please do so via phof.enquiries@phe.gov.uk.
1 comment
Comment by Cameron Russell posted on
Thank you for this informative and concise update, very useful,