Counting how many people have sadly died with COVID-19 is not straightforward. Public Health England publishes daily figures for deaths in people with a laboratory-confirmed test for COVID-19. The Office for National Statistics reports deaths where the disease is mentioned on a death certificate. Each method has its own strengths and limitations. You can find both on PHE’s COVID-19 Dashboard and we've previously blogged on how we define COVID-19 deaths.
But there is a third measure, which arguably provides the most comprehensive overview of the impact of the pandemic: excess deaths.
These are the number of deaths over and above what would be expected, based on trends in previous years. Because they capture deaths from all causes – not just COVID-19 – they give us an idea of both the direct and indirect impact of the pandemic.
Different organisations use different methods to measure excess deaths during the pandemic. PHE routinely produces three measures of excess deaths:
- Daily General Register Office (GRO) model, used for real time surveillance;
- Weekly excess mortality reports, which provide details for subgroups and can help to identify inequalities;
- and EuroMOMO to compare excess deaths between European countries.
GRO Model
The daily GRO measure is based on data from the general registry office and is used for real-time surveillance of excess mortality due to COVID-19. It is presented in PHE’s weekly flu and surveillance reports and is a daily model. The report presents the trend of estimated excess over time, but it usually doesn’t quote the number of excess deaths that are estimated for each day. The baseline of the model mainly uses data from the same time of year for the previous five years. Because it estimates the excess deaths by the day they occur, it includes a delay correction for the lag between the date of death and the day it is registered (when the data becomes available). This delay correction is based on the delays observed in historical data. While this method is incredibly powerful, adding the delay correction adds uncertainty to the estimate in the short term which makes analysis of smaller population groups less reliable.
Weekly excess mortality
The model in PHE’s weekly excess mortality reports is based on ONS data, and uses deaths by week of registration, rather than by week of occurrence, and makes adjustments to account for weeks with bank holidays. The report presents the estimated number of excess deaths that have occurred for each week and for the entire pandemic nationally and among subgroups. The baseline uses data from the same time of year for the previous five years and takes account of the trend over the past 5 years, the ageing population and variation in registrations around bank holidays. Because this method does not require a delay correction, it can be used to robustly estimate excess mortality among sub-groups of the population, including regions, local authorities, ethnic groups, age, sex and deprivation. It can also provide more detail about the death, such as place of death and cause of death as it is produced once fully coded data have been received.
EuroMOMO
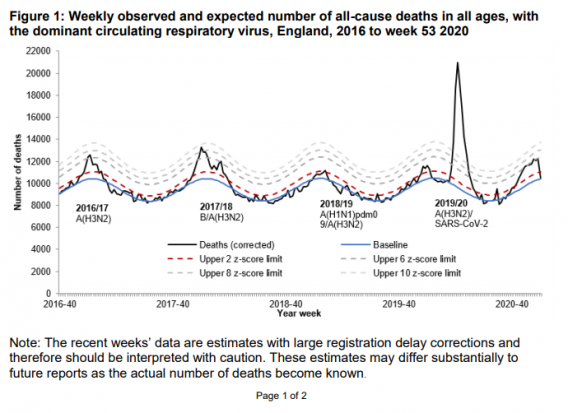
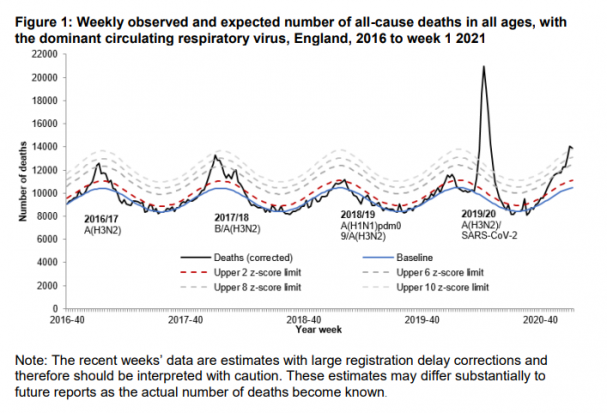
The EuroMOMO model is presented in PHE’s weekly all-cause mortality surveillance report. This method has been used historically to measure excess mortality from influenza and has been adapted for COVID-19 to use the most recent GRO data. Like the GRO report, the data is presented as a trend of estimated excess mortality over time without quoting the number of excess deaths that are estimated for each week. It measures deaths by date of occurrence, and applies a delay correction similar to the GRO method. For the baseline it looks at the past five years data. It takes into consideration the season to try to set a baseline of what would be expected in the absence deaths due to winter flu or extreme weather. The method has been developed so that flu seasons can be compared across countries in Europe, so it follows the methods set out by the EuroMOMO project.
A note of caution: the most recent data in both the GRO and EuroMOMO models should be viewed with extreme caution as they rely on modelled estimates to account for registration delays. These can change a great deal (higher or lower) by the time of the next report. For example, due to reporting delays over the Christmas period, Week 1 of the EuroMOMO model (below) appeared to show a downward trend.

But by Week 2 (below) it was clear deaths had in fact been rising rapidly.

