This is the second in a series of blogs summarising what we learn each time we update the Public Health Outcomes Framework (PHOF).
In our first blog we explained the value of PHOF, allowing us to make informed decisions based on data showing where we stand right now, but also allowing us to track our progress.
And we outlined what the PHOF covers; the full spectrum of what we understand as public health, presenting local authority data for many different health indicators and their determinants as well as offering professionals the chance to look at the national picture.
Our update for February 2017 includes a new indicator on antibiotic prescribing in primary care, some changed definitions (for example life expectancy and healthy life expectancy and prisoners with mental illness) and updates to a further 38 indicators including sickness absence, child injuries, cancer and non-cancer screening and air pollution.
New data on children and young people
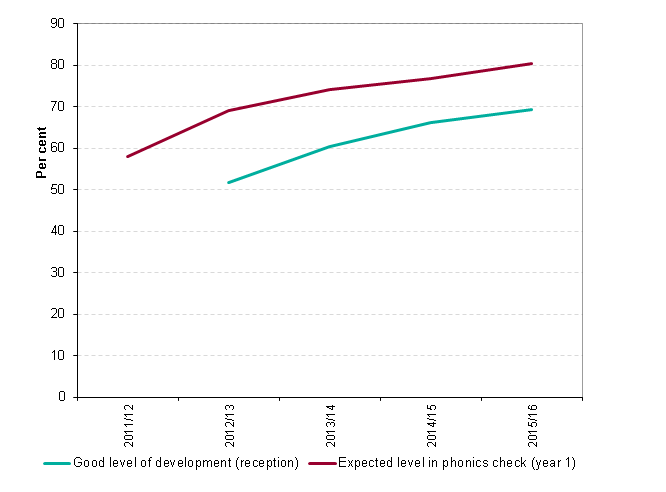
In this update we see that the proportion of children finishing reception with good development rose in 2015/16. And the proportion of children in Year 1 achieving a good level in the phonics screening test increased for the fourth consecutive year to 80.5%. However inequalities by area and population group remain.
 However we also see that the percentage of children classified as overweight or obese increased significantly for both children aged 4 to 5 and children aged 10 to 11. In both age groups, the percentages were higher in more deprived areas and for males, compared to females, and for those of black Caribbean and south Asian ethnicities.
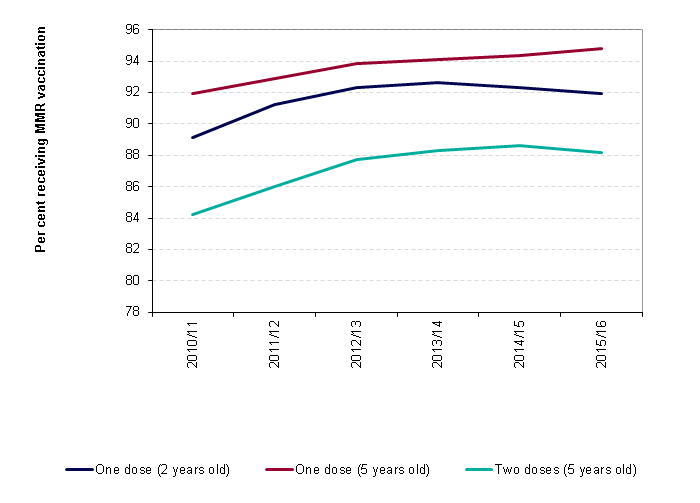
The PHOF contains a range of indicators linked to vaccination, including MMR. The proportion of 5 year olds receiving the MMR vaccination for one dose increased for the fourth consecutive year, to 94.8%. But the proportion of 5 year olds receiving the MMR vaccination for two doses reduced to 88.2% in 2015/16, following increases over the previous 4 years.
The proportion of 2 year olds receiving the MMR (measles, mumps and rubella) vaccination fell for the second consecutive year, to 91.9%.
The data also reveals that admissions to hospital caused by unintentional and deliberate injuries to children decreased, but for young people aged 15 to 24 years old, the rate increased from the previous year.
Other data to look out for
There was a significant reduction in the rate of casualties who were killed or seriously injured on England’s roads in 2013-15. This continues a reduction that has been seen over the past 5 periods.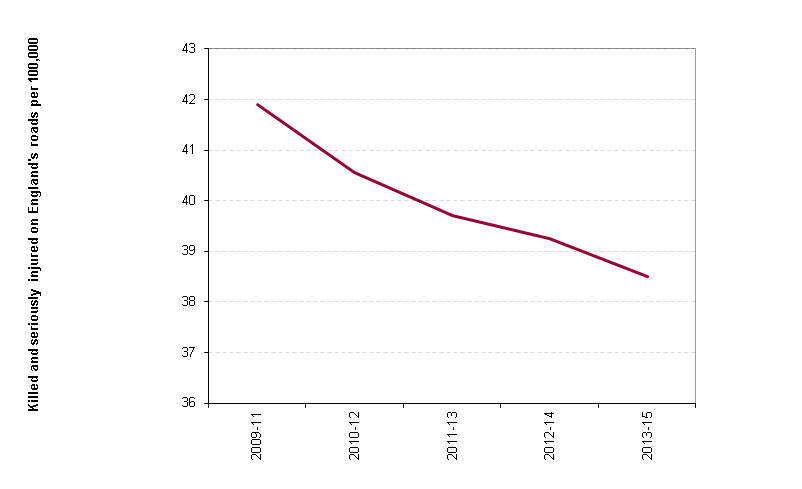 The PHOF also includes data on air pollution and we can see that the fraction of mortality attributable to air pollution reduced from 5.1% in 2014 to 4.7% in 2015. This is the second year in a row to see an improvement in mortality attributable to air pollution.
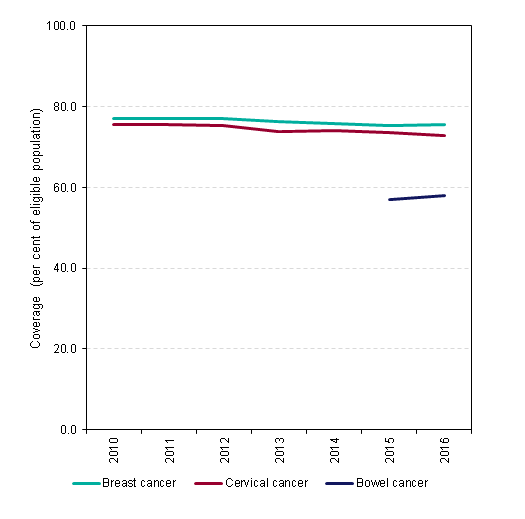
Breast and bowel cancer screening coverage increased but cervical decreased.
Finally, a new indicator has been added in this update - the number of antibiotic items prescribed in primary care in the NHS per STAR-PU (Specific Therapeutic Group - Prescribing Unit, an adjusted unit for age and sex).
Reductions in antibiotic consumption is a well-recognised target in Anti-Microbial Resistance (AMR) policies across PHE, the NHS, Department of Health and internationally, including the World Health Organisation.
In England, in 2015, 1.10 items were prescribed per STAR-PU. This is lower than the England mean prescribing in 2013/14.
Are you interested in health data? For more updates follow PHE on Twitter or view our collection of data tools.

